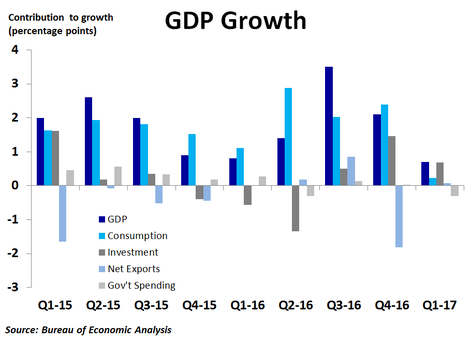
The contributions to growth were as follows: gross private domestic investment 0.69 percentage points (pp), which was weighed down by a lack of inventory building, consumer spending 0.23 pp, trade 0.07 pp and government spending -0.3 pp.
|
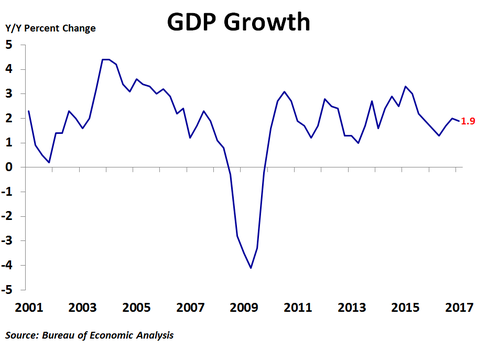
The U.S. economy was very weak in the first quarter, growing at an annualized rate of just 0.7% from the previous quarter, far below the 2.1% pace in the fourth quarter and less than the 1.1% consensus forecast. Compared to a year ago, the economy grew 1.9%, down from the fourth quarter’s 2.0% pace. Gross private domestic investment drove what little growth there was in the first quarter, rising 4.3% from the previous quarter. Still, this was half the rate of growth seen in the fourth quarter. Non-residential investment rose a strong 9.4%, the most since the last quarter of 2013, driven by a big rebound in investment in structures and solid growth in investment in equipment. Residential investment also had a strong quarter, rising 13.7%, as the housing market continued to sizzle with construction, sales and prices all rising. On the other hand, the change in private inventories subtracted from growth. In a break with recent trends, consumer spending was very weak, rising just 0.3%, the slowest growth since the fourth quarter of 2009. Spending on goods rose just 0.1%, as non-durable goods rose 1.5% but durable goods plunged 2.5%, primarily due to a big pullback in purchases of motor vehicles. This may have been due, in part, to a rise in auto loan rates since the presidential election. However, consumption of services was also weak, rising just 0.4%, the least in four years. Trade contributed a sliver of growth as exports rose slightly more than imports. On the downside, government spending fell 1.7%, as national defense spending plunged 4.0% while state and local government spending fell 1.6%. The contributions to growth were as follows: gross private domestic investment 0.69 percentage points (pp), which was weighed down by a lack of inventory building, consumer spending 0.23 pp, trade 0.07 pp and government spending -0.3 pp. Today’s report is the first look at the overall economy under new President Donald Trump. While growth was very disappointing, it came after relatively strong growth in the second half of last year, and is not much of an aberration from the Obama years. Although the first three months of his administration were lackluster, there were no significant changes to economic policy during this time. The healthcare bill failed and tax reform, trade and infrastructure were not even addressed. Early in Trump’s first term, optimism remains high but uncertainty is widespread.
0 Comments
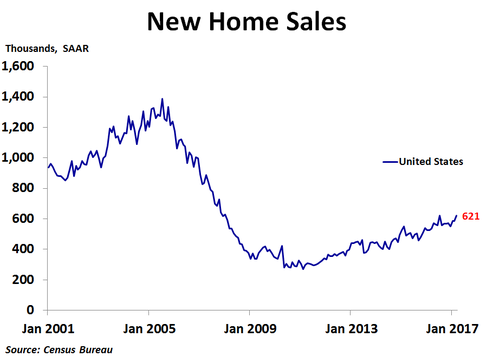
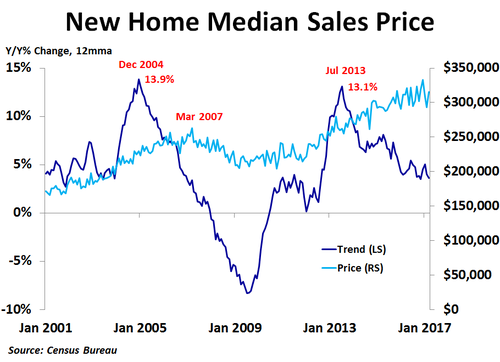
New home sales soared in March to 621K units on a seasonally adjusted annualized basis, an improvement on February’s 587K units, far better than the consensus forecast of 588K units and just shy of the post-recession high of 622K units reached in July 2016. Sales were up a very strong 5.8% from the prior month and 15.6% from a year ago. Sales rose the most in the Northeast, which saw a 25.8% increase from the prior month. Sales rose 16.7% in the West and 1.6% in the South, but declined 4.5% in the Midwest. Compared to a year ago, sales were up 32.6% in the West, 23.5% in the Midwest, 21.9% in the Northeast and just 5.9% in the South. In the first quarter, the national median price was down 2.2% from the prior year, the first decline since the fourth quarter of 2011. Prices were up a sharp 32.6% in the Northeast and a scant 1.2% in the West, but were down 3.7% in the Midwest and 6.0% in the South. The Census Bureau does not report regional median prices by month, only quarterly and annually. In March, the national median price rose 7.5% from the prior month but was up just 1.2% from the prior year. The 12-month moving average trend of price growth has been slowing over the last couple of years and is currently the slowest in four and a half years, suggesting new home prices may be near a peak. As with the existing home market, inventory continues to be a big story right now. In March, there was only 5.2 months’ worth of supply available, down from 5.4 months in February, far below the supply levels of the previous boom and not nearly enough to meet torrid demand. Fortunately, the number of new homes for sale has jumped in the last few months and are at the highest level since July 2009, which should bring some relief to frustrated buyers. Mortgage rates have declined noticeably over the last few weeks as investors have become more uncertain about the success or impacts of pro-growth policies under the new administration. In addition, inflation slowed in March, suggesting interest rates may stay fairly low in the near term.
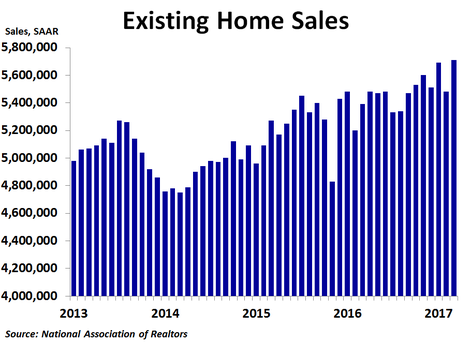
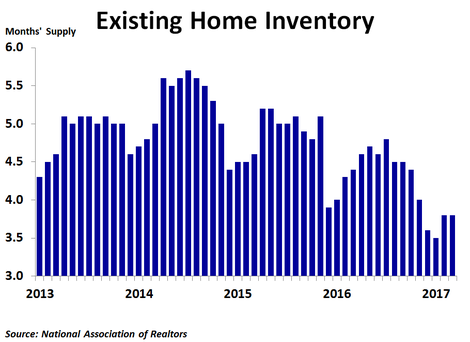
The path of home price growth during this housing cycle is nearly a mirror image of the path during the last cycle when viewed on a year-over-year percent change, 12-month moving average basis. If supply or mortgage rates move up, prices will likely fall, but big upside movements for either do not appear likely in the near term. Existing home sales rose in March to 5.71 million units on a seasonally adjusted annualized basis, a big jump from February’s 5.48 million units and more than the consensus forecast of 5.61 million units. Sales were up 4.4% from the prior month and 5.9% from a year ago, besting February’s 5.2% growth rate. By region, sales jumped 10.1% from the prior month in the Northeast and 9.2% in the Midwest following a fairly weak February for those regions. Sales rose a smaller 3.4% in the South following a strong performance in February. The West was the only region where sales fell, having declined by 1.6%. Compared to a year ago, sales were up a strong 8.5% in the South, 5.2% in the West, 4.1% in the Northeast and 3.1% in the Midwest. Median prices were up the most in the South at 8.6% compared to a year ago, while they were up 8.0% in the West, 6.2% in the Midwest and 2.8% in the Northeast. The national median price was up 6.8%, down from February’s 7.6% rate of growth. Sales rose 5.0% from February for condos and co-ops and 4.3% for single-family homes. On a year-ago basis, sales were up 6.1% for single-family homes and 5.0% for condos and co-ops. Prices were up 8.0% for condos and co-ops and 6.6% for single-family homes. Inventory continues to be the big story right now. In March, inventories jumped 5.8%, the third straight monthly increase and the most in a year. However, sales rose almost as fast, keeping the month’s supply at 3.8. The 12-month moving average fell further to just 4.2 months, down significantly from a couple years ago. One big reason that inventories are so low is that some people who bought homes at the peak of the bubble in 2006 still have not recuperated all of their losses. What homes do get listed are often scooped up quickly, and sellers are getting multiple offers that in some cases are above the asking price. This suggests a market top in prices may be near as buyers will likely not overbid for homes for too long. After a big jump following the election, mortgage rates have edged down again over the last couple months as investors have become a bit more concerned about the ability of the new administration to pass pro-growth policies, while geopolitical tensions have mounted. It is likely that the post-election jump in mortgage rates got some people off the fence to buy a house before rates rose further. Those sales may have been pulled forward, so the next couple months may see softer sales despite the recent decline in mortgage rates.
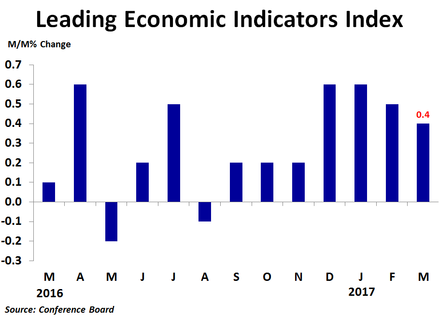
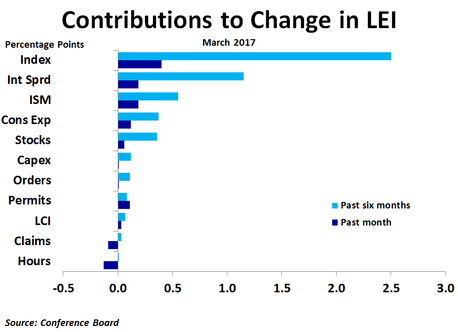
The leading economic indicators index rose 0.4% in March from the prior month following a downwardly revised 0.5% increase in February. The increase was better than the 0.2% consensus forecast. Compared to a year ago, the index was up a solid 2.8%, an improvement over January’s 2.5% pace. Over the six month period ending in March, the index was up 2.4%, up slightly from the 2.3% rate of growth in the six months to February. The big story in today’s report was the continued positive contribution from the ISM new orders index, which added 0.19 percentage points to the index, and has seen strong contributions for four straight months. During the last six months, this component has added 0.55 percentage points to the index, or 20% of the total growth. The interest rate spread contributed 0.19 percentage points in March. While its contribution over the last six months was greater than that for the ISM new orders component, it is not really a big story since it is almost always one of the biggest contributors. Another big story is the jump in consumer expectations of business conditions, which contributed 0.12 percentage points in March and has also seen four straight months of very strong contributions. The stock market also added support in March, but not as much as in December and February as investors have become a bit concerned about the probability of getting pro-business policies out of Washington, as well as uncertainty surrounding geopolitical tensions. Building permits increased in March, adding 0.11 percentage points. The biggest negative contribution came from average hours worked, which took away 0.13 percentage points. Initial jobless claims subtracted 0.09 percentage points from the index as average claims rose to 250K in March from 243K in February. Although the interest rate spread is often among the largest contributors, its contribution has been trending slightly lower over the last few months as investors have been turning back to bonds as initial optimism about the new administration’s economic policies has been followed by some doubt about the chances for successful implementation and the possible impacts on the economy and earnings. Geopolitical tensions have also buoyed bonds.
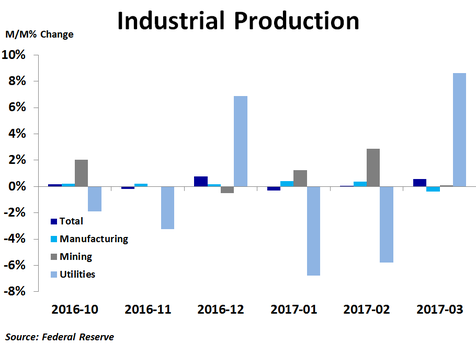
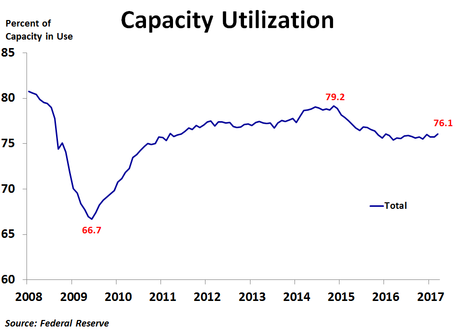
First quarter GDP is looking to be quite weak, which was predicted by the stalling in the LEI in the second half of last year. The rise in the LEI over the last few months suggests that growth should pick up by the summer. Industrial production rose 0.5% in March, slightly better than the 0.4% consensus forecast and much better than February’s 0.1% increase, which was revised up from no change. The increase was driven by an 8.6% jump in utility output after two months of big declines. This was offset by a 0.4% decline in manufacturing output. Mining output was little changed. Overall production was up 1.5% on a year-ago basis, the strongest in two years. In manufacturing, production was led by a 1.5% increase in petroleum and coal products and a 0.9% increase in computer and electronic products. On the downside, production of motor vehicles and parts fell 3.0%, in line with plunging vehicle sales, while production of apparel and leather goods fell 1.6% and production of electrical equipment, appliances and components fell 1.6%. Compared to a year ago, production was up 26.5% for natural gas distribution, the most by far, as furnaces kicked into gear with a return to more seasonable temperatures. Machinery production was up 4.5%, while computer and electronic products production was up 3.9%. Conversely, the worst performance was in apparel and leather goods, production of which was down 6.4%, and aerospace and miscellaneous transportation equipment, which was down 2.5%. Capacity utilization increased from 75.7% to 76.1%, but was still below the recent peak of 78.9% back in November 2014. This has helped to keep inflation largely subdued outside of energy for the last two years. The utilization rate has been fairly steady since reaching a recent low of 75.4% in March 2016. The most pressure is currently seen in oil and gas extraction, where 95.7% of capacity is in use. Nonmetallic mineral mining and quarrying and plastic materials and resin utilization is also high, at 90.7% and 88.6%, respectively. On the flip side, support activities for mining are currently only using 48.1% of capacity. Survey data for manufacturing has been quite strong recently, so the decline in manufacturing output in March is a bit of a surprise. It appears as though higher vehicle loan rates, which followed the rise in the 10-year yield due to increased optimism about the economy after the presidential election, have weighed on vehicle sales and production recently. This is a major reason why first quarter economic growth is expected to be quite weak. In turn, interest rates have been falling, which will hopefully revive the vehicle industry a bit.
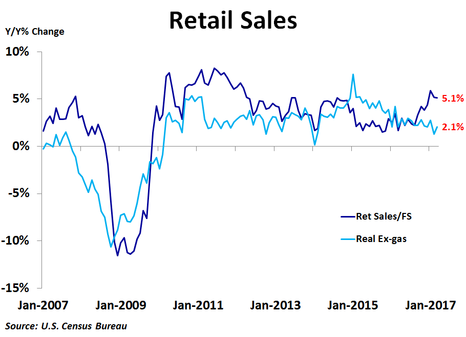
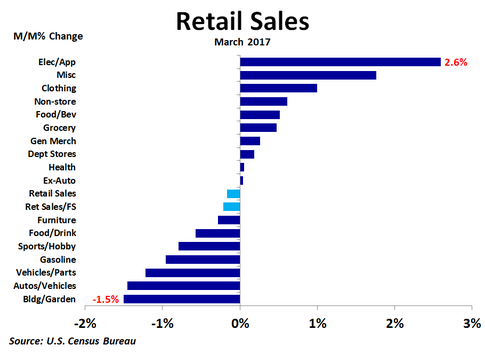
Retail sales fell 0.2% in March from the prior month, missing the consensus forecast of no change, following a 0.1% increase in February. Sales excluding autos were unexpectedly flat, while sales excluding autos and gas rose 0.1%, also less than expected. On a year-over-year basis, sales were up 5.1%, down slightly from February’s 5.2% pace. Food and beverage sales rose the most in dollars from the prior month, increasing by $308 million, or 0.5%. Non-store sales came in a close second, rising by $302 million, as purchasing online continues to be a more common way to shop. Grocery sales followed with a $254 million increase. Electronics and appliances led the way on a percentage basis, as sales rose $212 million, or 2.6%. Strength was also seen in miscellaneous goods (+1.8%) and clothing (+1.0%). The biggest decline in dollars came from vehicle sales, which plunged by $1.3 billion, or 1.5%. Building and garden supply sales followed with a $474 million, 1.5%, decline, while gasoline sales fell by $354 million, or 1.0%. These percentage declines were also the largest of all of the categories. Sales were higher on a year-over-year basis, led by a $5.4 billion, or 12.3%, increase in non-store sales. Vehicle sales were a close second with a $5.3 billion, or 6.4%, rise in sales, followed by a $4.4 billion, or 13.7%, increase in gasoline station sales . Thus, while lower vehicle and gasoline sales were major factors in weak overall sales in March, they were big factors in the year-ago comparisons. The largest dollar decline in sales was seen in department stores, where sales were down $620 million, or 4.7%, which was also the biggest percentage decline. If we take out the impact of gasoline sales, which are not really an indication of stronger or weaker economic growth but rather due to changing gas prices, ex-gas retail sales were up only 4.5% from a year ago in March. If we also adjust for inflation, we see that real ex-gas retail sales were up 2.1% in March, a nice rebound from February’s moribund 1.3% growth rate. This measure of retail sales growth, which went negative a year before the headline number leading up to the Great Recession, has been trending down over the last two years. Unfortunately, March’s rebound was not enough to break that trend.
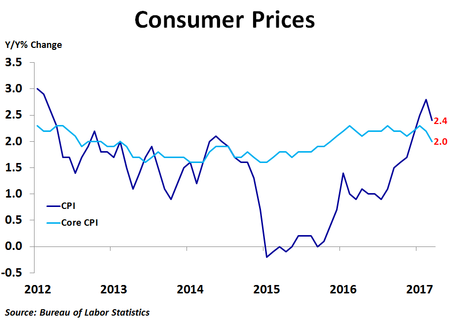
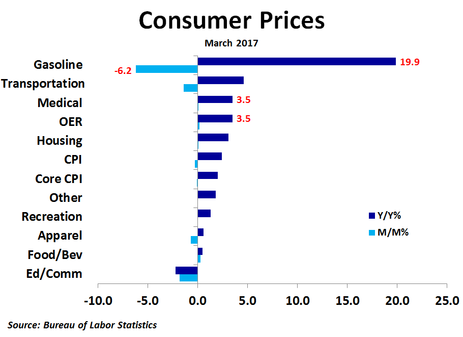
This report, along with the unexpected decline in consumer prices in March, may give the Fed some pause at its next rate setting meeting in May. Weak March data suggests a rate increase is less likely than a few weeks ago. Consumer prices fell 0.3% in March from the previous month, missing the consensus forecast of no change, following a 0.1% increase in February. Compared to a year ago, prices were up 2.4%, down from February’s 2.8% pace. Core prices, which exclude food and energy, fell 0.1%, missing the forecast of a 0.2% increase, and were up 2.0% on a year-over-year basis, the lowest since November 2015. Compared to a month ago, prices rose the most for fruits and vegetables (+1.6%), motor vehicle insurance (+1.2%), tobacco and smoking products (+0.5%), hospital services (+0.4%) and airline fares (+0.4%). Prices fell the most for gasoline (-6.2%), used cars and trucks (-0.9%), piped gas (-0.8%), fuel oil (-0.8%) and apparel (-0.7%). Thus, while air travel became more expensive, road travel became less expensive. Gasoline accounted for two-thirds of the overall decline in prices, while information, education and wireless phone services also had significant negative impacts. These declines were somewhat offset by a 0.2% rise in owners’ equivalent rent of primary residence. Compared to a year ago, prices were up the most for fuel oil (+24.9%), gasoline (+19.9%), piped gas service (+10.3%), motor vehicle insurance (+8.1%) and hospital services (+4.7%). Prices were down the most for used cars and trucks (-4.7%), meats and poultry (-2.6%), fruits and vegetables (-1.8%) and cereals and bakery products (-0.4%). Thus, on a year-ago basis, energy has pushed the price index higher while food and vehicles have pushed the index lower. The biggest contributions to the rise in the index on a year-ago basis came from owners’ equivalent rent of primary residence and gasoline, together accounting for over half of the increase. This report breaks the consistent accelerating trend that has been in place since last summer. Along with a weak jobs report and a decline in retail sales, economic data for March may give the Fed something to think about at its next meeting in May. With core inflation slowing down there does not appear to be an urgent need to raise interest rates further. It might be a good idea to wait and see if the soft data for March is a sign of a weakening economy or just a bad month. Even though the Fed raised rates last month, the 10-year Treasury yield has fallen amid weaker economic data and geopolitical tensions, helping to bring down mortgage rates as well. This should help to keep the all-important housing market going for a little while longer.
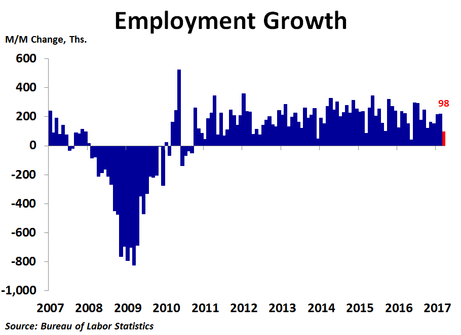
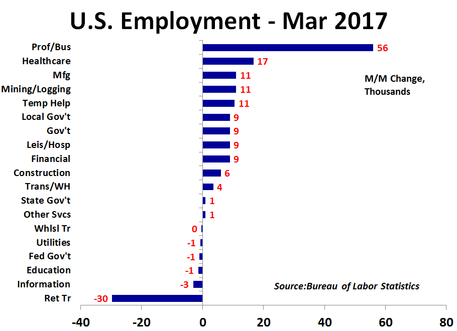
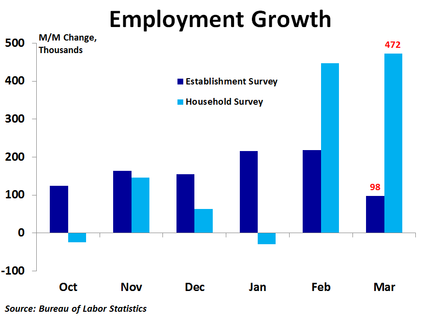
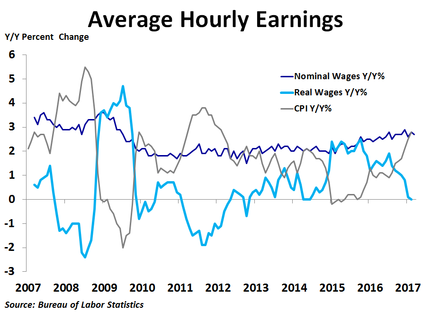
Job growth was very weak in March as the economy generated just 98K new jobs, down significantly from the 219K increase in February, and far below the 175K consensus forecast. In addition, revisions showed 38K fewer jobs were created in January and February. The rate of job growth slipped to 1.5% year-over-year, the slowest in four years. In this very weak report, only professional and business services saw any real strength, adding 56K new positions, driven largely by administrative and support services. Healthcare was a very distant second, creating just 17K new jobs, the fewest in three years. Manufacturing put 11K more people to work, which is a decent month for the industry but less than half the jobs created in February. Mining and logging did have a very good month as 11K more people found employment. On the downside, by far the biggest disappointment in today’s report is another massive 30K decline in retail trade employment following a 31K plunge in February, which was the biggest drop since December 2009. Many big box retailers are trimming staff in the wake of greater competition from online sales. Although construction added 6K jobs, it was a far cry from the strength seen during the last several months. This, along with much slower job growth in healthcare and a loss in education jobs following a big gain in February, are the main reasons for the big miss in today’s report. Despite the widespread weakness in hiring in March, the unemployment rate fell to 4.5% from 4.7% as household employment jumped by 472K while only 145K people entered the labor force, meaning the increase in the labor force was fully absorbed, while 326K people who were already in the labor force, but were not working, also found jobs. Job growth as reported in the household survey has been much stronger than that in the establishment survey the last two months, suggesting more job growth has been coming from smaller businesses and self-employment. Average hourly earnings rose 0.2% and were up 2.7% from a year ago, a slight decrease from the 2.8% pace in February. However, with inflation moving up recently, real wage growth has cratered and was flat in February. The stock market reaction to today’s report was muted, partly because weak hiring was offset by a lower unemployment rate, and partly because investors were weighing the consequences of the airstrikes in Syria. Markets will likely be on edge in the coming weeks.
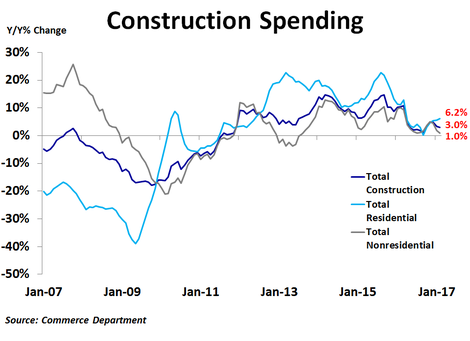
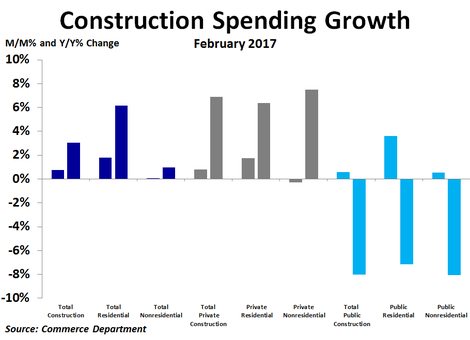
According to the Commerce Department, total construction spending rose by $9.0 billion, or 0.8%, in February to $1.19 trillion, very close to the peak seen before the recession. Compared to a year ago, spending was up just 3.0%, on the lower end of the range seen during the last couple of years. There was a noticeable difference in spending between residential and non-residential spending. While residential spending rose $8.7 billion, or 1.8%, from the prior month, non-residential spending inched up by just $237 million, or 0.03%. These measures were up 6.2% and 1.0% compared to a year ago, respectively. Thus, residential spending accounted for virtually all of the spending growth in February. Non-residential spending strength was led by a $1.9 billion increase in spending on power, a $1.2 billion increase in highways and streets and a $847 million increase in amusement and recreation. Weakness was led by a $1.8 billion decline in spending on communications, a $1.2 billion drop in manufacturing and a $792 million decline in healthcare. There was also a noticeable difference between private and public spending. Private spending rose by $7.3 billion, driven exclusively by residential projects. Non-residential spending fell by $1.2 billion, but within that was a $2.6 billion increase in spending on power projects. In contrast, public spending only increased by $1.6 billion, almost all of which came in the non-residential category. Public spending on non-residential projects rose by $1.4 billion, driven largely by a $1.1 billion increase in spending on highways and streets. Compared to a year ago, the strongest growth in total construction spending has come from lodging, office and commercial projects. Conversely, the biggest declines have been seen in sewage and waste disposal, conservation and development and water supply projects. The residential sector of the U.S. economy has been a pillar of strength over the last several years. This has helped to soften the blow from weaker government spending during the same period. Even so, the pace of residential spending growth is down from a peak of nearly 23% year-over-year two years ago to just 6.2% in February. With inflation become a bit more of a concern, the Fed is primed to raise interest rates further. If this results in higher mortgage rates, residential spending could soften, meaning spending on other projects would need to fill the void.
|
Archives
September 2017
Categories
All
|
 RSS Feed