Ed Kashmarek - The Everyday Economist
  • Home
  • About
    • Skills
    • Volunteering
    • Music
    • Microfinance
    • Photos
    • Book List
  • Work Samples
  • Reports
  • Blog
  • Charts
  • Podcast
  • Webinars
  • Tableau
    • Employment Analysis Tool (Web)
    • Employment Analysis Tool (Mobile)
    • GDP Analysis Tool (Web)
    • GDP Analysis Tool (Mobile)
    • MN Housing
  • Feedback
  • Join Email List
  • Booking

Leading Economic Indicators Index Rises in May but There Are Concerns

6/28/2017

0 Comments

 
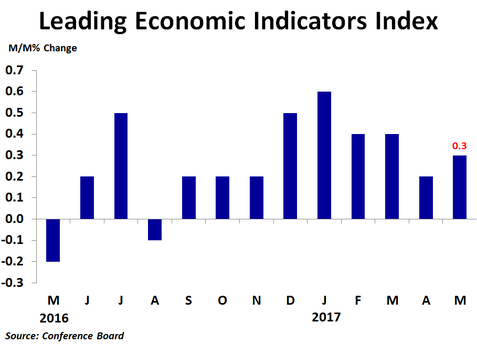
​The leading economic indicators index rose 0.3% in May from the prior month following a downwardly revised 0.2% increase in April. The increase matched the consensus forecast. Compared to a year ago, the index was up 2.7%, more than April’s 2.2% pace. Over the six month period ending in April, the index was up 2.3%, up slightly from the 2.2% rate of growth in the six months to April.
Picture
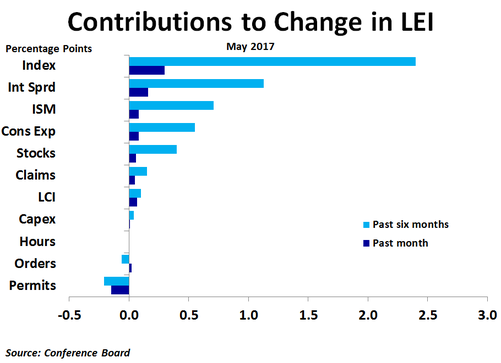
The interest rate spread between the 10-year Treasury yield and the Federal Funds rate led the way in May, contributing 0.16 percentage points to the growth in the index. Although this ties April’s reading for the smallest contribution from this component since October as the spread has narrowed, this component has still contributed the most to the rise in the index over the past six months. The ISM new orders index contributed 0.08 percentage points as the index itself rose 2 points to 59.5 from 57.5 in April. Consumer expectations of business conditions also added 0.08 percentage points as consumers remain hopeful that economic policy changes will boost business and the economy. The stock market contributed 0.06 percentage points as the market continues to rise despite political uncertainty and signs of a slowing housing market. Jobless claims contributed 0.05 percentage points in May as average weekly claims fell to 239,700 from 243,000 in a sign of continued labor market strength. Core capital goods orders and average weekly hours contributed virtually nothing in May.           

​The biggest negative contribution once again came from building permits, the third time in the last four months this has been the case. Permits took 0.15 percentage points away from growth in the index as permits fell to 1.168 million units on an annualized basis in May from 1.228 million units in April. 
Picture
Although the interest rate spread is often among the largest contributors, its contribution has been trending slightly lower over the last few months as investors have been turning back to bonds as initial optimism about the new administration’s economic policies has been followed by some doubt about the chances for successful implementation and the possible impacts on the economy and earnings, especially surrounding the healthcare overhaul.

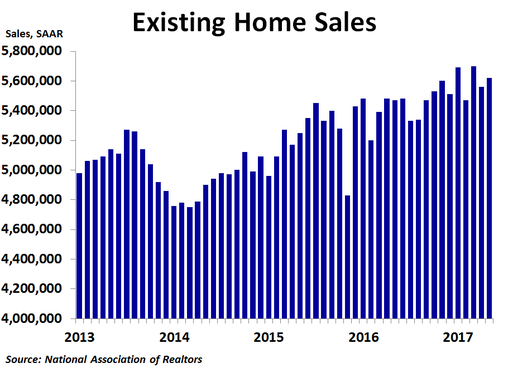
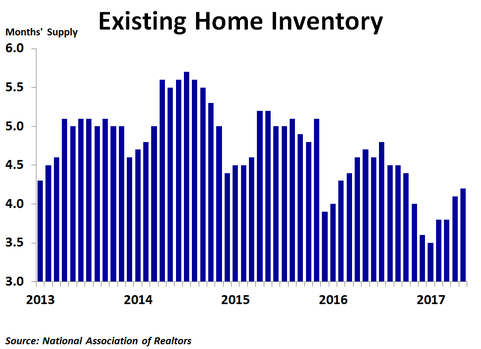
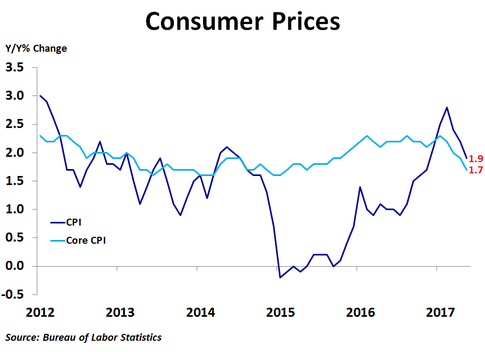
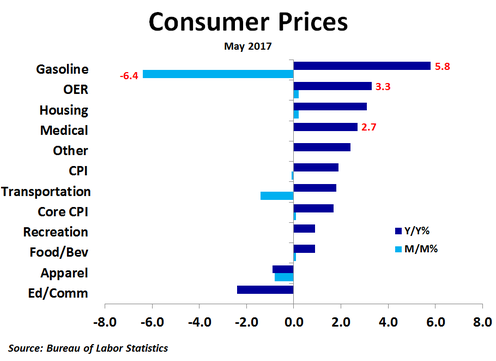
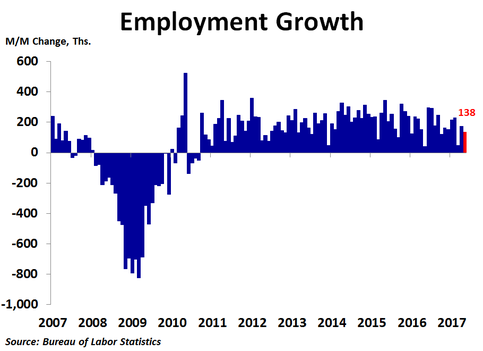
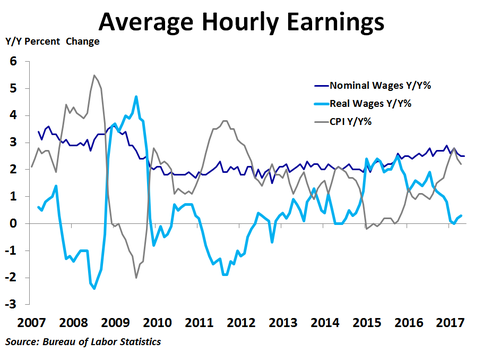
​Given slowing inflation, weak wage and job growth and signs of a possible top in housing, the Fed’s June rate hike appears a bit misplaced. Talk of trimming its balance sheet also seems to be coming at the wrong time.
0 Comments

New Home Sales Rise in May Despite Soaring Prices

6/25/2017

0 Comments

 
​New home sales rose in May to 610K units on a seasonally adjusted annualized basis, up from 593K units in April, which was revised up from 569K units, and well above the consensus forecast of 590K units. Sales were up 2.9% from April and 7.8% from a year ago.
Picture
Sales rose 13.3% from the prior month in the West and 6.2% in the South. However, sales fell 10.8% in the Northwest and plunged 25.7% in the Midwest, the second straight large monthly decline, taking sales to the lowest level in that region since February 2015. Compared to a year ago, sales were up 14.1% in the West, 12.9% in the South and 3.1% in the Northeast. In the Midwest, sales were down 24.7%.

​In the first quarter, the national median price was down 2.2% from the prior year, the first decline since the fourth quarter of 2011. Prices were up a sharp 32.6% in the Northeast and a scant 1.2% in the West, but were down 3.7% in the Midwest and 6.0% in the South. The Census Bureau does not report regional median prices by month, only quarterly and annually. In May, the national median price soared to a record $345,800, an 11.5% jump from the prior month, the largest monthly increase since October 2014. Compared to a year ago, the median price was up 16.8%, the most since September 2015. The 12-month moving average trend of price growth has been slowing over the last couple of years, and despite this measure rising from 3.1% in April to 4.2% in May, the downward trend remains in place, suggesting new home prices may be getting close to a cyclical peak. That being said, the big increase in the median price in May had a lot to do with a change in the mix of homes sold, as there was a big decline in sales in the $200K-$299K price range, while higher priced homes saw an increase in sales. 
Picture
​As with the existing home market, inventory continues to be a big story right now. In May, there was only 5.3 months’ worth of supply available. Although that is up from 4.9 months in March, it is still far below the supply levels of the previous boom. Fortunately, the number of new homes for sale has jumped in the last few months and is at the highest level since July 2009, which has helped to keep prices fairly stable recently. In addition, mortgage rates have been trending down over the last few weeks amid political uncertainty and slowing inflation. With supply and mortgage rates remaining very low, new home prices will likely remain elevated. Buyers would rejoice if high prices lured more supply to the market. 
0 Comments

Existing Home Sales Rebound in May but Price Growth Continues to Slow

6/25/2017

0 Comments

 
​Existing home sales rose in May to 5.62 million units on a seasonally adjusted annualized basis, up from April’s 5.56 million units and more than the consensus forecast of 5.55 million units. Sales were up 1.1% from the prior month and up 2.7% from a year ago, slightly better than April’s 1.5% pace. 
Picture
By region, sales increased 6.8% from the prior month in the Northeast, by far the strongest growth of all regions. Sales rose 3.4% in the West and 2.2% in the South. The Midwest had a very bad month, as sales plunged 5.9%, but this followed a strong April for the region, while all other regions saw declines in April. Compared to a year ago, sales were up a strong 4.5% in the South, 3.4% in the West and 2.6% in the Northeast, but were down 0.8% in the Midwest. Median prices were up the most in the Midwest at 7.3% compared to a year ago, while they were up 6.9% in the West, 5.3% in the South and 4.7% in the Northeast. The national median price was up 5.8%, down from April’s 6.1% rate of growth. It was the third straight drop in the year-ago rate of growth.

​By type, sales rose 1.6% from April for condos and co-ops and 1.0% for single-family homes. On a year-ago basis, sales were up 3.2% for condos and co-ops and 2.7% for single-family homes. Prices were up 6.0% for single-family homes and 4.8% for condos and co-ops. 
Picture
Inventory continues to be a big story right now. In May, inventories rose 2.1%. However, since sales rose a smaller 1.1%, the ratio of inventories to sales, or the months’ supply, rose from 4.1 to 4.2. Even so, the 12-month moving average held steady at 4.2 months, down significantly from a couple years ago. One big reason that inventories are so low is that some people who bought homes at the peak of the bubble in 2006 still have not recuperated all of their losses. What homes do get listed are often scooped up quickly, and sellers are getting multiple offers that in some cases are above the asking price. This suggests a market top in prices may be near as buyers will likely not overbid for homes for too long. Indeed, the year-over-year rate of price growth is slowing in the South and West and appears to be close to a peak in the Midwest.

​Today’s report is welcome relief after a terrible April for the housing market. With mortgage rates trending down over the last couple months, a rebound for housing was expected. Still, May continued a recent pattern of ups and downs for sales. If the recent pattern holds, June may be another down month. 
0 Comments

Retail Sales Decline in May as Gasoline Station Sales Plunge

6/15/2017

0 Comments

 
Retail sales fell 0.3% in May from the prior month, missing the consensus forecast of a 0.1% increase, following a 0.4% increase in April. Sales excluding autos and gas also missed expectations, coming in unchanged versus the 0.3% forecast. On a year-over-year basis, sales were up 3.8%, down noticeably from the recent peak growth rate of 5.6% reached in January.
Picture
This was a very weak report as the only real strength was seen in non-store sales, which increased by $405 million, or 0.8%, and led the way on both a dollar and percent growth basis. The next biggest increase by dollar value was a $75 million, or 0.3%, increase in clothing. Food and beverage stores saw sales rise by $47 million, or 0.1%. Furniture sales rose by $35 million, or 0.4%, which was the second best percentage increase. In all, only six of sixteen categories saw higher sales compared to April. The biggest decline on a dollar basis was seen in gasoline station sales, which plunged by $923 million, or 2.4%, as both prices and gallons purchased dropped. Electronics and appliances sales fell by $237 million, or 2.8%, following a very strong April. Vehicles and parts sales, an important economic driver, fell by $224 million, or 0.2%, as the downturn in the vehicle market resumed after an uptick in April. The miscellaneous category also saw lower sales, falling by $141 million, or 1.3%.

​Sales were higher on a year-over-year basis, led by a $4.8 billion, or 10.2%, increase in non-store sales. Vehicles and  parts were a close second with a $3.5 billion, or 3.7%, rise in sales, followed by a $3.0 billion, or 10.8%, increase in building and garden supplies sales . Thus, non-store sales were a major driver in sales on both a month-ago and year-ago basis, but vehicles and parts, although strong year-over-year, have been weak on a monthly basis recently. The largest dollar decline in sales was seen in department stores, where sales were down $487 million, or 3.7%. However, the biggest percentage decline was in sports and hobby stores sales, down 4.7% from a year ago.
Picture
If we take out the impact of gasoline sales, which are not really an indication of stronger or weaker economic growth but rather due to changing gas prices, ex-gas retail sales were up only 3.6% from a year ago in May. If we also adjust for inflation, we see that real ex-gas retail sales were up just 1.7% in May, and the growth rate has been trending down.

​Despite this weak report, along with other weak May data, the Federal Reserve raised interest rates. It may be a costly move.
0 Comments

Consumer Prices Fall in May and Year-Ago Growth is Slowing

6/14/2017

0 Comments

 
​Consumer prices fell 0.1% in May from the previous month, missing the consensus forecast of no change, following a 0.2% increase in April. Compared to a year ago, prices were up 1.9%, down from April’s 2.2% pace. Core prices, which exclude food and energy, rose 0.1%, missing the forecast of a 0.2% increase, and were up 1.7% on a year-over-year basis, the slowest rate of growth since May 2015.
Picture
Compared to a month ago, prices rose the most for piped gas service (+1.9%), non-alcoholic beverages (+1.1%), motor vehicle insurance (+1.1%), medical care commodities (+0.4%) and cereals and bakery products (+0.3%). Prices fell the most for gasoline (-6.4%), fuel oil (-2.8%), airline fares  (-2.7%), apparel (-0.8%) and fruits and vegetables (-0.6%). Thus, air and road travel both became less expensive, but it became more expensive to insure a vehicle. Owners’ equivalent rent, motor vehicle insurance and piped gas service had the largest positive effects on the price index, while the biggest negative effects came from gasoline, apparel and airline fares.

Compared to a year ago, prices were up the most for piped gas service (+12.8%), fuel oil (+11.9%), tobacco and smoking products (+7.6%), motor vehicle insurance (+7.0%) and gasoline (+5.8%). It is notable that gasoline is up only 5.8% from a year ago after being up 30.7% back in February. Prices were down the most for used cars and trucks (-4.3%), airline fares (-2.9%), meats and poultry (-2.1%), apparel (-0.9%) and cereals and bakery products (-0.2%). Thus, on a year-ago basis, energy has pushed the price index higher while food and vehicles have pushed the index lower. The biggest positive effects on a year-ago basis came from owners’ equivalent rent of primary residence, medical care and gasoline, while the biggest negative effects came from wireless phone services, used cars and trucks and meats. 
Picture
​With May data showing weak job growth, slowing wage growth, flat producer prices, a decline in consumer prices and weaker than expected retail sales, one would think the Fed would have held rates steady at today’s FOMC meeting. However, they raised interest rates anyway, citing a low unemployment rate and expected improvement in inflation and job growth. Although core producer prices are accelerating on a year-ago basis, consumer price growth is slowing. Thus, either the Fed is concerned about producer price inflation passing through soon, or they are more focused on policy normalization, or most likely, both. 
0 Comments

Job Growth Far Below Expectations in May

6/2/2017

0 Comments

 
​Job growth slowed in May as the economy generated just 138K new jobs, down from the 174K increase in April, and much less than the 185K consensus forecast. Even worse, revisions showed 29K fewer jobs were created in March and 37K fewer jobs were created in April than previously reported. Still, the rate of job growth inched up to 1.6% year-over-year, but this was due to a very weak May a year ago, making year-ago comparisons more favorable.
Picture
Professional and business services led the way in May with a 38K increase in payrolls, equal to April’s growth. Healthcare added 32K new jobs, but this was far less than the 45K added in April. Leisure and hospitality services put 31K people back to work, but this was also far less than April’s reading. Temporary help services increased staff by 13K. Following a couple weak months, construction employment rebounded by 11K, but even that was still much weaker than the first couple months of the year, in line with the recent slowing in home building and sales. Financial services added 11K new jobs and mining put 6K more people to work, the seventh straight positive month.

On the downside, government saw the biggest decline as a net 9K people lost their jobs, with the losses coming at the state and local levels. Retail trade lost another 6K positions, bringing total losses to 80K over the last four months as the industry continues to struggle with competition from online retailers. Manufacturing lost 1K jobs as the motor vehicle industry slump continues. Information services employment cut another 2K jobs, the eighth straight decline as the sector’s worst slump since the recession continues.

​The 36K difference in job growth in May versus April was largely due to much less hiring in leisure and hospitality services, healthcare, manufacturing and government.
Picture
Although the unemployment rate fell from 4.4% to 4.3%, it was because 429K people left the labor force, 234K of which were previously employed and 195K of which were  previously unemployed. Thus, the decline in the unemployment rate was for the wrong reasons.  

Average hourly earnings rose 0.2% and were up 2.5% from a year ago, down a bit from the 2.9% pace back in December. With inflation cooling recently, real wage growth has rebounded slightly but remains very weak.

​Today’s report, along with weak housing data, a slowing vehicle market and softening inflation, gives more credence to a call for no Fed rate hike in June.  
0 Comments

Construction Spending Unexpectedly Plunges in April

6/1/2017

0 Comments

 
​According to the Commerce Department, total construction spending plunged by $17.0 billion, or 1.4%, in April to $1.218 trillion, but remained above the peak reached before the recession. Compared to a year ago, spending was up 6.7%, a noticeable improvement from March’s 5.0% rate of growth, but this was only because the previous April was very weak, making the year-over-year comparison much more favorable. 
Picture
Unlike in months past, in April both residential and non-residential spending fell. While residential spending dropped by $4.7 billion, or 0.9%, from the prior month, non-residential spending plunged by $12.3 billion, or 1.7%. These measures were up 15.6% and 0.8% compared to a year ago, respectively.

There was only one kernel of strength in non-residential spending, which came from a $263 million, or 2.4%, increase in spending on water supply projects. The only other positive was a meager $8.0 million increase in office buildings. Weakness was widespread, led by a $3.5 billion decline in highways and streets, a $2.1 billion drop in power projects and a $1.5 billion decline in educational facilities.               

​Also unlike past months, both private and public spending declined. Private spending fell by $6.4 billion, split nearly evenly between residential and non-residential spending,. Public construction plunged by $10.6 billion, driven almost entirely by non-residential spending. Weakness in private non-residential spending was led by a $1.3 billion decline in manufacturing and a $1.3 billion drop in power projects. The only real strength was a $1.1 billion increase in office buildings. On the public side, the weakness was led by a $3.4 billion plunge in highways and streets. Public non-residential spending accounted for over half of the drop in total construction spending. 
Picture
Compared to a year ago, the strongest growth in total construction spending has come from residential, office and commercial projects. Conversely, the biggest declines have been seen in sewage and waste disposal, religious facilities and conservation projects.

​The residential sector of the U.S. economy has been a pillar of strength over the last several years. This has helped to soften the blow from weaker government spending during the same period. Despite falling interest rates, housing activity was quite weak in April. This is a concern for the economy, and along with slowing inflation, just may lead the Fed to hold rates steady at its June FOMC meeting.          
0 Comments

    Archives

    September 2017
    August 2017
    July 2017
    June 2017
    May 2017
    April 2017
    March 2017
    February 2017
    June 2013
    May 2013

    Categories

    All
    Construction Spending
    CPI
    Employment Report
    Existing Home Sales
    GDP
    Housing Market Index
    Import Prices
    Industrial Production
    Leading Economic Indicators
    New Home Sales
    Personal Income And Outlays
    Producer Prices
    Retail Sales
    Small Business Optimism
    Trade

    RSS Feed

Proudly powered by Weebly