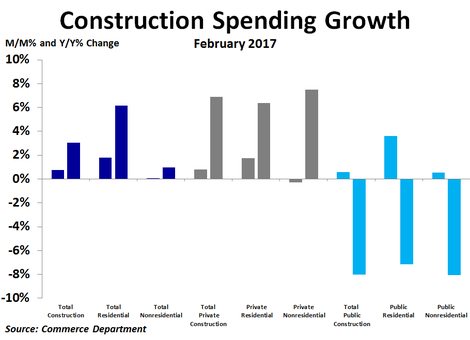
According to the Commerce Department, total construction spending rose by $9.0 billion, or 0.8%, in February to $1.19 trillion, very close to the peak seen before the recession. Compared to a year ago, spending was up just 3.0%, on the lower end of the range seen during the last couple of years.
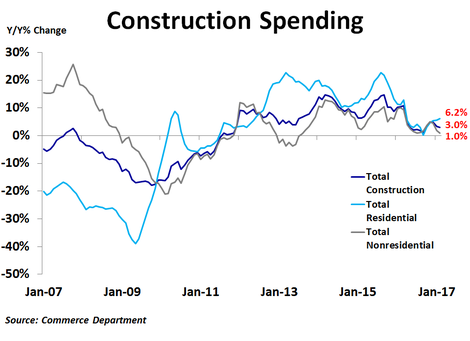
There was a noticeable difference in spending between residential and non-residential spending. While residential spending rose $8.7 billion, or 1.8%, from the prior month, non-residential spending inched up by just $237 million, or 0.03%. These measures were up 6.2% and 1.0% compared to a year ago, respectively. Thus, residential spending accounted for virtually all of the spending growth in February.
Non-residential spending strength was led by a $1.9 billion increase in spending on power, a $1.2 billion increase in highways and streets and a $847 million increase in amusement and recreation. Weakness was led by a $1.8 billion decline in spending on communications, a $1.2 billion drop in manufacturing and a $792 million decline in healthcare.
There was also a noticeable difference between private and public spending. Private spending rose by $7.3 billion, driven exclusively by residential projects. Non-residential spending fell by $1.2 billion, but within that was a $2.6 billion increase in spending on power projects. In contrast, public spending only increased by $1.6 billion, almost all of which came in the non-residential category. Public spending on non-residential projects rose by $1.4 billion, driven largely by a $1.1 billion increase in spending on highways and streets.
Compared to a year ago, the strongest growth in total construction spending has come from lodging, office and commercial projects. Conversely, the biggest declines have been seen in sewage and waste disposal, conservation and development and water supply projects.
The residential sector of the U.S. economy has been a pillar of strength over the last several years. This has helped to soften the blow from weaker government spending during the same period. Even so, the pace of residential spending growth is down from a peak of nearly 23% year-over-year two years ago to just 6.2% in February. With inflation become a bit more of a concern, the Fed is primed to raise interest rates further. If this results in higher mortgage rates, residential spending could soften, meaning spending on other projects would need to fill the void.
 RSS Feed