New home sales rose in January to 555K units on a seasonally adjusted annualized basis, an improvement on December’s 535K units, but less than the consensus forecast of 576K units. Sales were up 3.7% from the prior month and 5.5% from a year ago.
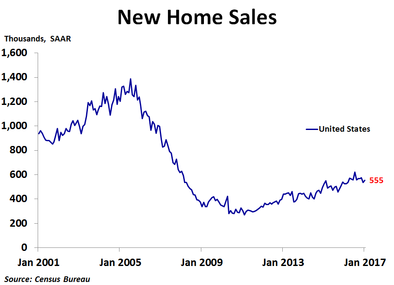
By region, sales rose the most in the Northeast, which saw a 15.8% increase from the prior month. Sales rose 14.8% in the Midwest and 4.3% in the South, but declined 4.4% in the West. Compared to a year ago, sales were up a strong 22.2% in the Northeast, 16.2% in the West and 4.5% in the Midwest, but were down 1.0% in the South.
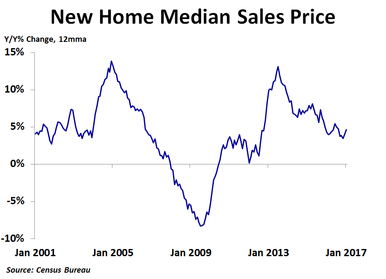
In the fourth quarter, median prices were up 1.6% y/y in the Midwest, but were down 2.0% in the South, 2.5% in the West and 16.7% in the Northeast. The Census Bureau does not report regional median prices by month, only quarterly and annually. Despite the 7.5% y/y increase in the national median price in January, the 12-month moving average trend of price growth has been slowing over the last couple of years, suggesting we may be near a peak in prices for new homes.
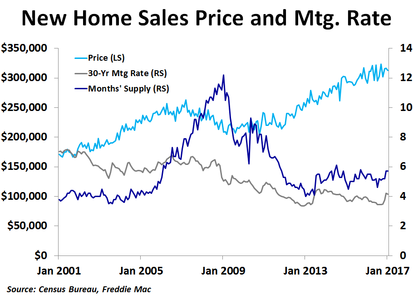
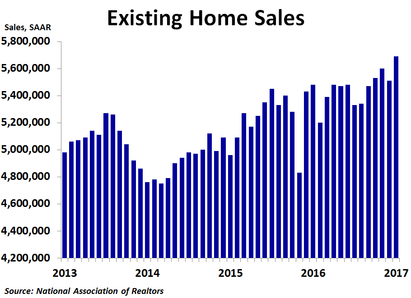
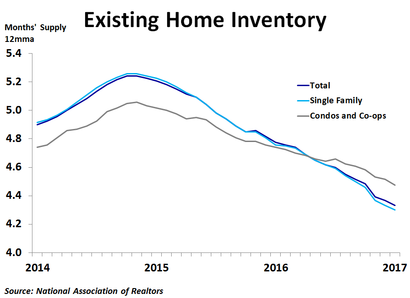
As with the existing home market, inventory continues to be a big story right now. In January, there was only 5.7 months’ worth of supply available. While this is a bit higher than the 5.3 month average over the past year, it is still far below the supply levels of the previous boom, and not enough to meet torrid demand. Fortunately, the number of new homes for sale has jumped in the last couple months, which should bring some relief to frustrated buyers. Builders are likely reluctant to ramp up construction too much partly due to the risk of overbuilding and causing another crash, and partly because current demand is being driven by ultra-low mortgage rates, which are not only unsustainable, but are now on the rise. Rising mortgage rates may be starting to temper demand as mortgage applications have dropped in 3 of the last 4 weeks, so we may be near a turning point in the housing market.
In the fourth quarter, median prices were up 1.6% y/y in the Midwest, but were down 2.0% in the South, 2.5% in the West and 16.7% in the Northeast. The Census Bureau does not report regional median prices by month, only quarterly and annually. Despite the 7.5% y/y increase in the national median price in January, the 12-month moving average trend of price growth has been slowing over the last couple of years, suggesting we may be near a peak in prices for new homes.
As with the existing home market, inventory continues to be a big story right now. In January, there was only 5.7 months’ worth of supply available. While this is a bit higher than the 5.3 month average over the past year, it is still far below the supply levels of the previous boom, and not enough to meet torrid demand. Fortunately, the number of new homes for sale has jumped in the last couple months, which should bring some relief to frustrated buyers. Builders are likely reluctant to ramp up construction too much partly due to the risk of overbuilding and causing another crash, and partly because current demand is being driven by ultra-low mortgage rates, which are not only unsustainable, but are now on the rise. Rising mortgage rates may be starting to temper demand as mortgage applications have dropped in 3 of the last 4 weeks, so we may be near a turning point in the housing market.
Interestingly, the path of home price growth during this housing cycle is nearly a mirror image of the path of home price growth during the last cycle when viewed on a year-over-year percent change, 12-month moving average basis. If supply or mortgage rates move up, prices will likely fall. If they both move up, prices could fall significantly. With inflation on the rise and the Fed primed to raise interest rates, this low-mortgage-rate-induced housing boom may be coming to an end. Stay tuned!
 RSS Feed