Ed Kashmarek - The Everyday Economist
  • Home
  • About
    • Skills
    • Volunteering
    • Music
    • Microfinance
    • Photos
    • Book List
  • Work Samples
  • Reports
  • Blog
  • Charts
  • Podcast
  • Webinars
  • Tableau
    • Employment Analysis Tool (Web)
    • Employment Analysis Tool (Mobile)
    • GDP Analysis Tool (Web)
    • GDP Analysis Tool (Mobile)
    • MN Housing
  • Feedback
  • Join Email List
  • Booking

Existing Home Sales Fall in August as Inventories Decline

9/25/2017

0 Comments

 
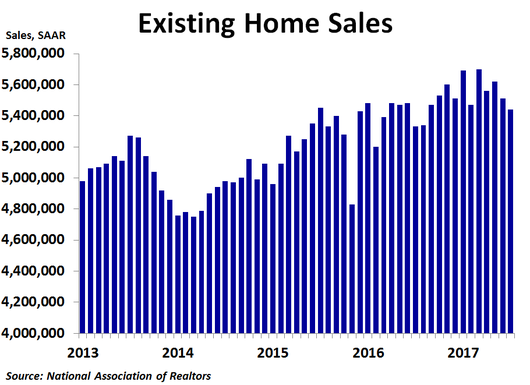
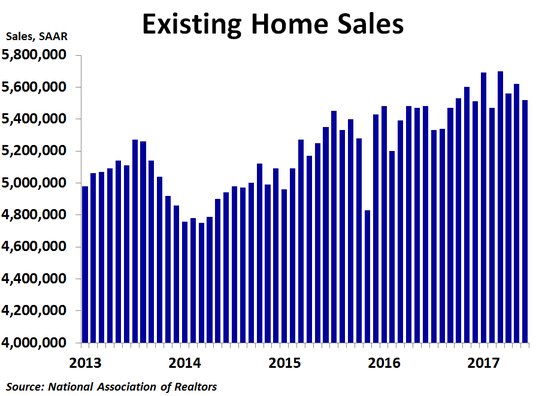
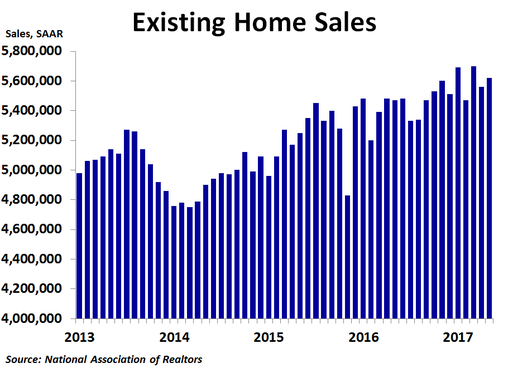
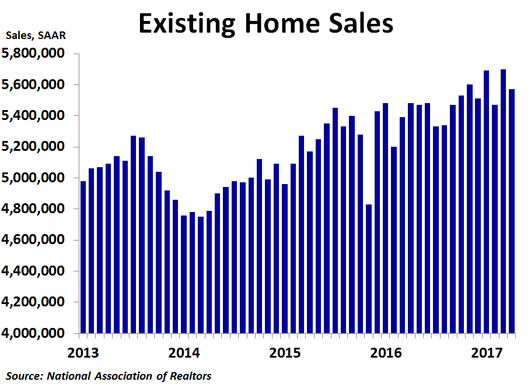
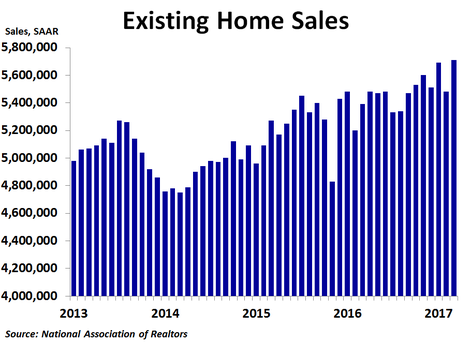
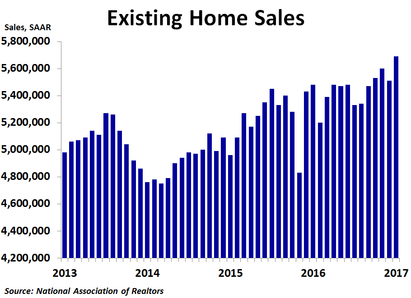
​Existing home sales fell in August to 5.35 million units on a seasonally adjusted annualized basis, down from July’s 5.44 million units, less than the consensus forecast of 5.48 million units and the lowest reading since last August. Sales were down 1.7% from the prior month and were up just 0.2% from a year ago, also the lowest reading since last August. 
Picture
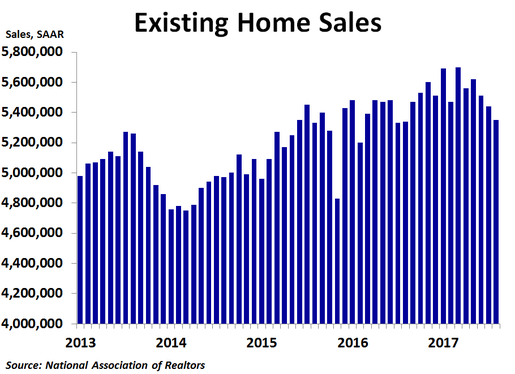
By region, sales increased 10.8% from the prior month in the Northeast and 2.4% in the Midwest, but fell 4.8% in the West and 5.7% in the South. Compared to a year ago, sales were up the most in the Northeast at 1.4% and were up 0.8% in both the West and Midwest. Sales were down 0.9% in the South. Although weakness in the South could be partly due to Hurricane Harvey, the South has been on a downward trend for the last few months. Median prices were up the most in the West at 7.7% compared to a year ago, while they were up 5.6% in the Northeast, 5.4% in the South and 5.0% in the Midwest. The national median price was up 5.6%, down from July’s 6.1% rate of growth and the least since December.

​By type, sales were up 1.7% compared to the prior month for condos and co-ops but down 2.1% for single-family homes. On a year-ago basis, sales were up 0.4% for single-family homes but down 1.6% for condos and co-ops. Prices were up 5.6% for single-family homes and 5.4% for condos and co-ops. 
Picture
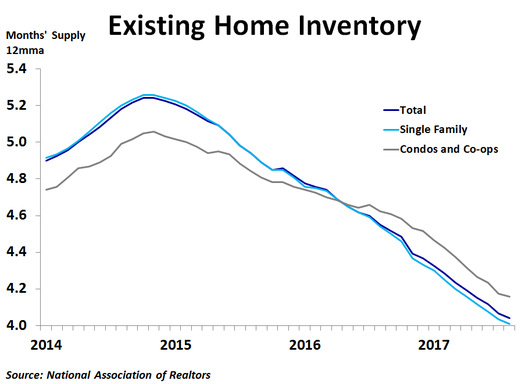
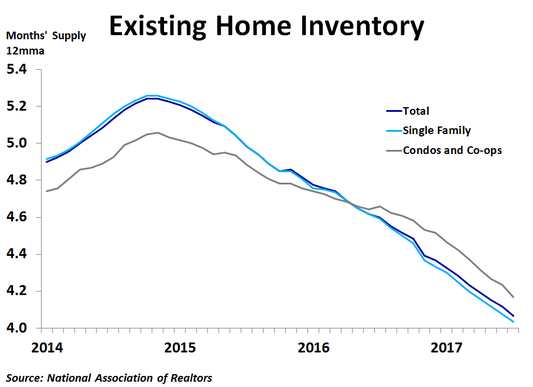
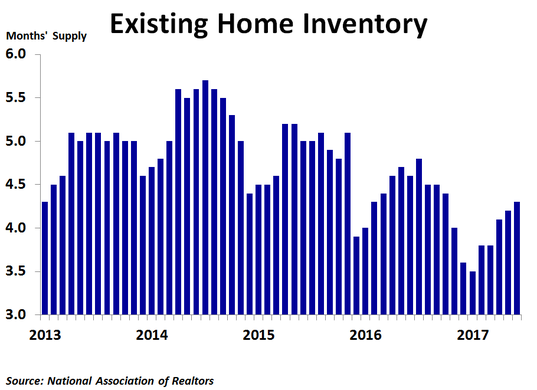
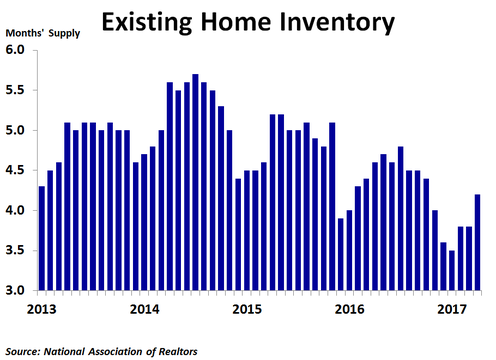
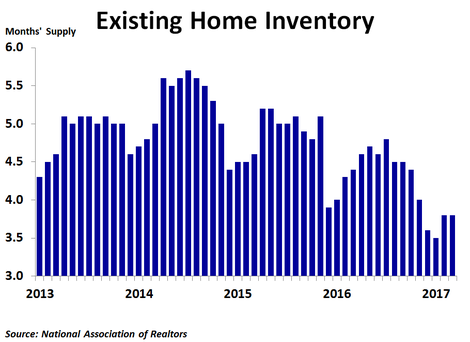
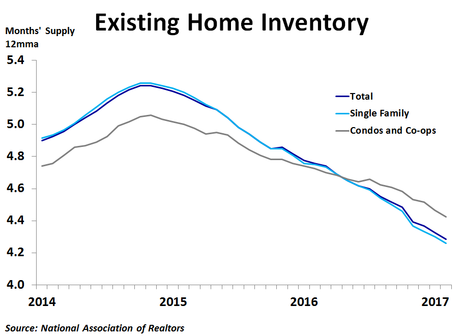
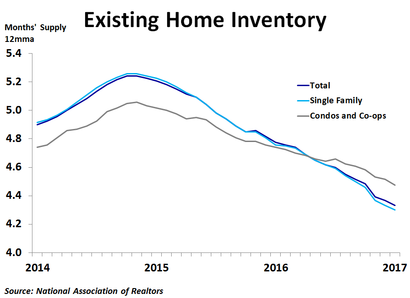
Inventory continues to be a big story right now. In August, inventories fell 2.1%. However, since sales fell a slightly smaller 1.7%, the ratio of inventories to sales, or the months’ supply, held virtually steady at 4.2 for the fourth straight month. However, the 12-month moving average slid to 4.0 months, down significantly from a couple years ago. One big reason that inventories are so low is that some people who would like to upgrade are finding prices too high so they are staying in their current home, preventing others from buying their house and keeping supply limited. What homes do get listed are often scooped up quickly, and sellers are getting multiple offers that in some cases are above the asking price. This suggests we may be close to a cyclical a peak in prices.

​Sales fell in August despite mortgage rates staying below 4.0% for a third straight month. With inflation below the Fed’s target of 2.0%, the Fed held rates steady at last week’s meeting. However, they finally gave the market a start date of October for unwinding their balance sheet. This could send mortgage rates higher, but inflation will also be a big factor. 
0 Comments

Existing Home Sales Fall in July Despite Declining Prices and Low Mortgage Rates

8/25/2017

0 Comments

 
​Existing home sales fell in July to 5.44 million units on a seasonally adjusted annualized basis, down from June’s 5.51 million units, less than the consensus forecast of 5.57 million units and the lowest reading since last August. Sales were down 1.3% from the prior month but were up 2.1% from a year ago.
Picture
By region, sales increased 5.0% from the prior month in the West and 2.2% in the South, but fell 5.3% in the Midwest and plunged 14.5% in the Northeast. Compared to a year ago, sales were up the most in the West at 5.0% and were up 3.6% in the South. Sales were down 1.5% in the Northeast and 1.6% in the Midwest. For the Midwest, it was the fourth straight month without an increase in sales from the prior year. Median prices were up the most in the West at 7.6% compared to a year ago, while they were up 6.7% in the South, 5.9% in the Midwest and 4.1% in the Northeast. The national median price was up 6.2%, down slightly from June’s 6.3% rate of growth.

​By type, sales were down 0.8% compared to the prior month for single-family homes and down 4.8% for condos and co-ops. On a year-ago basis, sales were up 5.3% for condos and co-ops and just 1.7% for single-family homes. Prices were up 6.3% for single-family homes and 5.3% for condos and co-ops. 
Picture
Inventory continues to be a big story right now. In July, inventories fell 1.0%. However, since sales fell a slightly larger 1.3%, the ratio of inventories to sales, or the months’ supply, held steady at 4.2 for the third straight month. The 12-month moving average also held steady at 4.1 months, down significantly from a couple years ago. One big reason that inventories are so low is that some people who bought homes at the peak of the bubble in 2006 still have not recuperated all of their losses. On the other hand, many who would like to upgrade are finding prices too high so they are staying in their current home, preventing others from buying their house and keeping supply limited. What homes do get listed are often scooped up quickly, and sellers are getting multiple offers that in some cases are above the asking price. This suggests we may be getting very close to a cyclical a peak in prices.

​Sales fell in July despite mortgage rates staying below 4.0% for a second straight month. With inflation below the Fed’s target of 2.0% and political uncertainty weighing on bond yields, mortgage rates remain very favorable. When the Fed starts to trim its balance sheet, mortgage rates could start to rise. Stay tuned! 
0 Comments

Existing Home Sales Fall in June Amid Lower Inventories and Higher Prices

7/24/2017

0 Comments

 
​Existing home sales fell in June to 5.52 million units on a seasonally adjusted annualized basis, down from May’s 5.62 million units and less than the consensus forecast of 5.58 million units. Sales were down 1.8% from the prior month and up just 0.7% from a year ago, the lowest year-ago increase since August. 
Picture
By region, sales increased 3.1% from the prior month in the Midwest, the only region to see an increase in sales in June. The rebound in the Midwest in June was not a surprise since sales in May were very weak. Elsewhere, sales fell 0.8% in the West, 2.6% in the Northeast and 4.7% in the South. Compared to a year ago, sales were up the most in the West at 2.5% and up 1.3% in the Northeast. Sales were flat compared to a year ago in the South and the Midwest. Median prices were up the most in the Midwest at 7.7% compared to a year ago, while they were up 7.4% in the West, 6.2% in the South and 4.1% in the Northeast. The national median price was up 6.5%, up from May’s 5.7% rate of growth and the first increase in the year-ago rate of growth in four months.

By type, sales were flat compared to the prior month for condos and co-ops and down 2.0% for single-family homes. On a year-ago basis, sales were up 1.6% for condos and co-ops and 0.6% for single-family homes. Prices were up 6.6% for single-family homes and 6.5% for condos and co-ops.
Picture
Inventory continues to be a big story right now. In June, inventories fell 0.5%. However, since sales fell a larger 1.8%, the ratio of inventories to sales, or the months’ supply, rose from 4.2 to 4.3. Even so, the 12-month moving average slipped a few decimal points to 4.1 months, down significantly from a couple years ago. One big reason that inventories are so low is that some people who bought homes at the peak of the bubble in 2006 still have not recuperated all of their losses. On the other hand, many who would like to upgrade are finding prices too high so they are staying in their current home, preventing others from buying their house and keeping supply limited. What homes do get listed are often scooped up quickly, and sellers are getting multiple offers that in some cases are above the asking price. This suggests a peak in prices may be near.

​Sales fell in June despite a decline in mortgage rates. On Wednesday, the Federal Reserve is expected to provide more details on the plan to reduce its balance sheet, which could push mortgage rates higher. The real estate market would be well advised to tune in. 
0 Comments

Existing Home Sales Rebound in May but Price Growth Continues to Slow

6/25/2017

0 Comments

 
​Existing home sales rose in May to 5.62 million units on a seasonally adjusted annualized basis, up from April’s 5.56 million units and more than the consensus forecast of 5.55 million units. Sales were up 1.1% from the prior month and up 2.7% from a year ago, slightly better than April’s 1.5% pace. 
Picture
By region, sales increased 6.8% from the prior month in the Northeast, by far the strongest growth of all regions. Sales rose 3.4% in the West and 2.2% in the South. The Midwest had a very bad month, as sales plunged 5.9%, but this followed a strong April for the region, while all other regions saw declines in April. Compared to a year ago, sales were up a strong 4.5% in the South, 3.4% in the West and 2.6% in the Northeast, but were down 0.8% in the Midwest. Median prices were up the most in the Midwest at 7.3% compared to a year ago, while they were up 6.9% in the West, 5.3% in the South and 4.7% in the Northeast. The national median price was up 5.8%, down from April’s 6.1% rate of growth. It was the third straight drop in the year-ago rate of growth.

​By type, sales rose 1.6% from April for condos and co-ops and 1.0% for single-family homes. On a year-ago basis, sales were up 3.2% for condos and co-ops and 2.7% for single-family homes. Prices were up 6.0% for single-family homes and 4.8% for condos and co-ops. 
Picture
Inventory continues to be a big story right now. In May, inventories rose 2.1%. However, since sales rose a smaller 1.1%, the ratio of inventories to sales, or the months’ supply, rose from 4.1 to 4.2. Even so, the 12-month moving average held steady at 4.2 months, down significantly from a couple years ago. One big reason that inventories are so low is that some people who bought homes at the peak of the bubble in 2006 still have not recuperated all of their losses. What homes do get listed are often scooped up quickly, and sellers are getting multiple offers that in some cases are above the asking price. This suggests a market top in prices may be near as buyers will likely not overbid for homes for too long. Indeed, the year-over-year rate of price growth is slowing in the South and West and appears to be close to a peak in the Midwest.

​Today’s report is welcome relief after a terrible April for the housing market. With mortgage rates trending down over the last couple months, a rebound for housing was expected. Still, May continued a recent pattern of ups and downs for sales. If the recent pattern holds, June may be another down month. 
0 Comments

Existing Home Sales Fall in April as Supply Remains Low While Price Growth Cools

5/24/2017

0 Comments

 
​Existing home sales fell in April to 5.57 million units on a seasonally adjusted annualized basis, down from March’s 5.70 million units and less than the consensus forecast of 5.65 million units. Sales were down 2.3% from the prior month and up 1.6% from a year ago, much less than March’s 5.8% pace. 
Picture
By region, sales increased 3.8% from the prior month in the Midwest, the only region to see gains. Sales declined 2.7% in the Northeast, 3.3% in the West and 5.0% in the South. While pullbacks were not a surprise for the Northeast and the South following big increases in March, the decline in the West came after a weak March and was the third drop in a row. Compared to a year ago, sales were up a strong 3.6% in the South and 3.5% in the West, but were down 0.7% in the Midwest and 2.7% in the Northeast. Median prices were up the most in the South at 7.9% compared to a year ago, while they were up 7.8% in the Midwest, 6.8% in the West and just 1.6% in the Northeast. The national median price was up 6.0%, down from March’s 6.9% rate of growth.

​By type, sales fell 1.6% from March for condos and co-ops and 2.4% for single-family homes. On a year-ago basis, sales were up 1.6% for both single-family homes and condos and co-ops. Prices were up 6.1% for single-family homes and 5.6% for condos and co-ops. 
Picture
Inventory continues to be a big story right now. In April, inventories jumped 7.2%, typical for this time of year. This, combined with the slowdown in sales, pushed the supply up to 4.2 months. Even so, the 12-month moving average held steady at 4.2 months, down significantly from a couple years ago. One big reason that inventories are so low is that some people who bought homes at the peak of the bubble in 2006 still have not recuperated all of their losses. What homes do get listed are often scooped up quickly, and sellers are getting multiple offers that in some cases are above the asking price. This suggests a market top in prices may be near as buyers will likely not overbid for homes for too long. Indeed, the year-over-year rate of price growth is slowing in every region except for the Midwest.

​Today’s report is in line with weakness seen in housing starts and new home sales for April. The good news is that mortgage rates have been trending down over the last couple months amid increased political uncertainty, which should boost housing as we head into the summer. The bad news is that the Fed seems ready to hike interest rates again. Stay tuned!
0 Comments

Rising Inventories Fuel Strong Existing Home Sales in March

4/21/2017

0 Comments

 
​Existing home sales rose in March to 5.71 million units on a seasonally adjusted annualized basis, a big jump from February’s 5.48 million units and more than the consensus forecast of 5.61 million units. Sales were up 4.4% from the prior month and 5.9% from a year ago, besting February’s 5.2% growth rate. 
Picture
By region, sales jumped 10.1% from the prior month in the Northeast and 9.2% in the Midwest following a fairly weak February for those regions. Sales rose a smaller 3.4% in the South following a strong performance in February. The West was the only region where sales fell, having declined by 1.6%. Compared to a year ago, sales were up a strong 8.5% in the South, 5.2% in the West, 4.1% in the Northeast and 3.1% in the Midwest. Median prices were up the most in the South at 8.6% compared to a year ago, while they were up 8.0% in the West, 6.2% in the Midwest and 2.8% in the Northeast. The national median price was up 6.8%, down from February’s 7.6% rate of growth.

Sales rose 5.0% from February for condos and co-ops and 4.3% for single-family homes. On a year-ago basis, sales were up 6.1% for single-family homes and 5.0% for condos and co-ops. Prices were up 8.0% for condos and co-ops and 6.6% for single-family homes.

​Inventory continues to be the big story right now. In March, inventories jumped 5.8%, the third straight monthly increase and the most in a year. However, sales rose almost as fast, keeping the month’s supply at 3.8. The 12-month moving average fell further to just 4.2 months, down significantly from a couple years ago. One big reason that inventories are so low is that some people who bought homes at the peak of the bubble in 2006 still have not recuperated all of their losses. What homes do get listed are often scooped up quickly, and sellers are getting multiple offers that in some cases are above the asking price. This suggests a market top in prices may be near as buyers will likely not overbid for homes for too long. 
Picture
​After a big jump following the election, mortgage rates have edged down again over the last couple months as investors have become a bit more concerned about the ability of the new administration to pass pro-growth policies, while geopolitical tensions have mounted. It is likely that the post-election jump in mortgage rates got some people off the fence to buy a house before rates rose further. Those sales may have been pulled forward, so the next couple months may see softer sales despite the recent decline in mortgage rates. 
0 Comments

Existing Home Sales Fall in February

3/22/2017

0 Comments

 
​Existing home sales fell in February to 5.48 million units on a seasonally adjusted annualized basis, less than January’s 5.69 million units and less than the consensus forecast of 5.55 million units. Sales were down 3.7% from the prior month but up 5.4% from a year ago, besting January’s 3.8% growth rate. 
Picture
By region, sales rose 1.3% from the prior month in the South. Sales fell in all the other regions, including a 3.1% decline in the West, a 7.0% drop in the Midwest and a 13.8% plunge in the Northeast. Compared to a year ago, sales were up a strong 9.6% in the West, 5.9% in the South, 2.6% in the Midwest and 1.5% in the Northeast. Median prices were up the most in the West and the South at 9.6% compared to a year ago, while they were up 6.1% in the Midwest and 4.5% in the Northeast. 

By type, sales fell 3.0% from January for single-family homes and plunged 9.2% for condos and co-ops. On a year-ago basis, sales were up 5.8% for single-family homes and 1.7% for condos and co-ops. Prices were up 8.2% from a year earlier for condos and co-ops and 7.6% for single-family homes. Inventory was down 10.6% y/y for condos and co-ops and down 11.6% y/y for single-family homes.  

​Inventory continues to be the big story right now. In February, there was only 3.8 months’ worth of supply available. While that was a slight up-tick from January, the 12-month moving average was just 4.3 months, down significantly from a couple years ago. One big reason that inventories are so low is that some people who bought homes at the peak of the bubble in 2006 still have not recuperated all of their losses, so they are reluctant to sell, choosing instead to wait for prices to go even higher. In addition, an improving economy has helped to open up job opportunities for many people, some of whom had to move. Thus, it could be that many people simply don’t want to or need to sell their home, even though prices have reached pre-crash peaks in some places.

Picture
​Although mortgage rates were largely unchanged in February, the lagged effects of the big jump after the presidential election may be starting to take root. February’s sales miss could also be payback for a very strong January. Where the market goes from here will largely depend on the success or failure of the new administration to follow through on promises of pro-growth policies, which have been the catalyst for a jump in confidence, as well as higher interest rates. With prices already high, higher rates will likely weigh on housing.
0 Comments

Existing Home Sales Jump in January

2/22/2017

0 Comments

 
Existing home sales rose in January to 5.69 million units on a seasonally adjusted annualized basis, an improvement on December’s 5.51 million units, far better than the 5.58 million forecast and the highest since February 2007. Sales were up 3.3% from the prior month and 3.8% from a year ago, more than doubling December’s 1.5% year-ago pace.
Picture
By region, sales rose the most in the West, which saw a 6.6% increase from the prior month. Sales rose 5.3% in the Northeast and 3.6% in the South, but declined 1.5% in the Midwest. Compared to a year ago, sales were up a strong 8.4% in the West, 6.7% in the Northeast and 3.1% in the South, but were down 0.8% in the Midwest. Median prices were up the most in the South at 9.2% y/y, while they were up 6.8% in the West, 6.5% in the Midwest and just 2.5% in the Northeast. 

​By type, sales jumped 8.3% over December for condos and co-ops but rose just 2.6% for single family homes. On a year-ago basis, sales were up 4.8% for condos and co-ops and 3.7% for single family homes. Prices were up 7.3% from a year earlier for single family homes and up 6.2% for condos and co-ops. Inventory was down 10.0% y/y for single family homes and 13.2% y/y for condos and co-ops.  
Picture
Inventory continues to be the big story right now. In January, there was only 3.6 months’ worth of supply available, the lowest in several years, while the 12-month moving average was just 4.3 months. With mortgage rates still fairly low on a historical basis, demand for existing homes is high, but with inventory so low, it is definitely a seller’s market, and a very tight one at that. One big reason that inventories are so low is that some people who bought homes at the peak of the bubble in 2006 still have not recuperated all of their losses, so they are reluctant to sell, choosing instead to wait for prices to go even higher. In addition, an improving economy has helped to open up job opportunities for many people, some of whom had to move. Thus, it could be that many people simply don’t want to or need to sell their home right now, even though prices have reached pre-crash peaks in some places. Recent college graduates, new job finders and those who have finally saved enough to buy a home are all competing for starter and mid-market homes, but are finding very slim pickings. Rising mortgage rates may be starting to temper demand as mortgage applications have dropped in 3 of the last 4 weeks, so if you are thinking about selling, do it. 
0 Comments

    Archives

    September 2017
    August 2017
    July 2017
    June 2017
    May 2017
    April 2017
    March 2017
    February 2017
    June 2013
    May 2013

    Categories

    All
    Construction Spending
    CPI
    Employment Report
    Existing Home Sales
    GDP
    Housing Market Index
    Import Prices
    Industrial Production
    Leading Economic Indicators
    New Home Sales
    Personal Income And Outlays
    Producer Prices
    Retail Sales
    Small Business Optimism
    Trade

    RSS Feed

Proudly powered by Weebly