Ed Kashmarek - The Everyday Economist
  • Home
  • About
    • Skills
    • Volunteering
    • Music
    • Microfinance
    • Photos
    • Book List
  • Work Samples
  • Reports
  • Blog
  • Charts
  • Podcast
  • Webinars
  • Tableau
    • Employment Analysis Tool (Web)
    • Employment Analysis Tool (Mobile)
    • GDP Analysis Tool (Web)
    • GDP Analysis Tool (Mobile)
    • MN Housing
  • Feedback
  • Join Email List
  • Booking

New Home Sales Fall in August Despite Low Mortgage Rates and Higher Inventories

9/26/2017

0 Comments

 
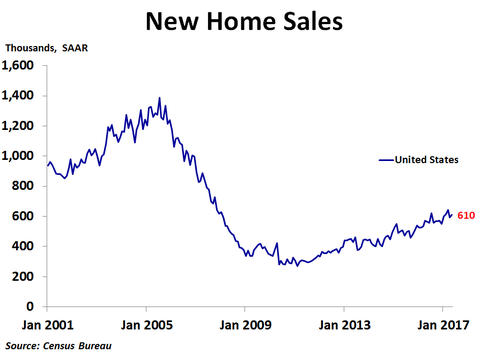
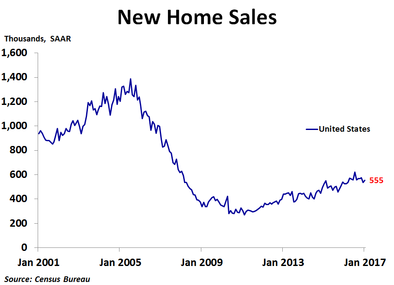
New home sales fell in August to 560K units on a seasonally adjusted annualized basis, down from 580K units in July, which was revised up from 571K units, less than the consensus forecast of 583K units and the lowest since December 2016. Sales were down 3.4% from July but were up 0.2% from a year ago.
Picture
Sales fell the most in the South, down 4.7% from July, as Hurricane Harvey wreaked havoc near the end of the month. Sales fell 2.7% in the West, which may have been partly due to the massive wildfires, and fell 2.6% in the Northeast. Sales in the Midwest were flat.

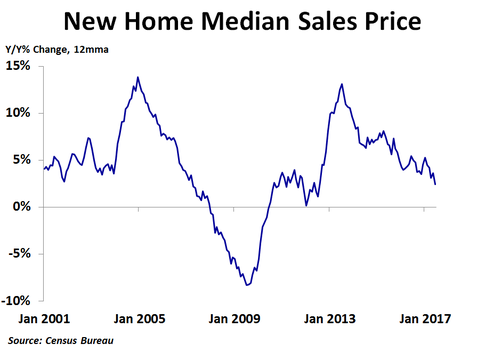
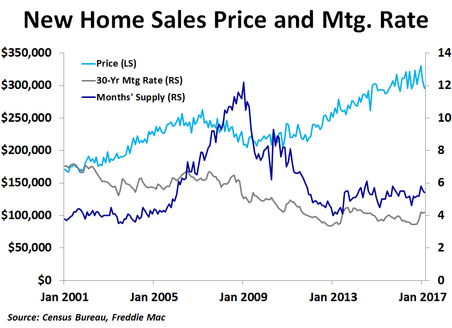
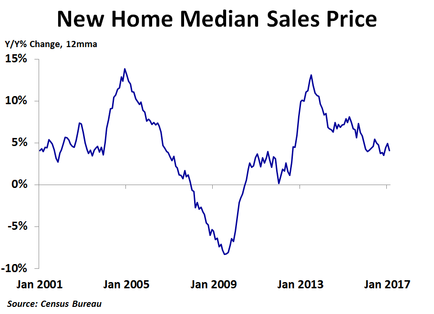
​In the second quarter, the national median price was up 1.8% from the prior year. Prices were up 7.6% in the Midwest and 2.4% in the West, but were down 1.6% in the South and 6.6% in the Northeast. The Census Bureau does not report regional median prices by month, only quarterly and annually. In August, the national median price fell to $300,200, a 6.2% decline from the prior month and the biggest since May 2016, following a 1.1% increase in July. This was the sixth straight month where the direction of price changes on a month-ago basis was opposite that of the prior month. Compared to a year ago, the median price was up just 0.4%. After revisions, the 12-month moving average trend of price growth has been fairly steady over the last couple of years, coming in at 3.9% in August, up a bit from 2.9% in January 2016. This contrasts with a noticeable downward trend in this measure before the price revisions in today’s report.  
Picture
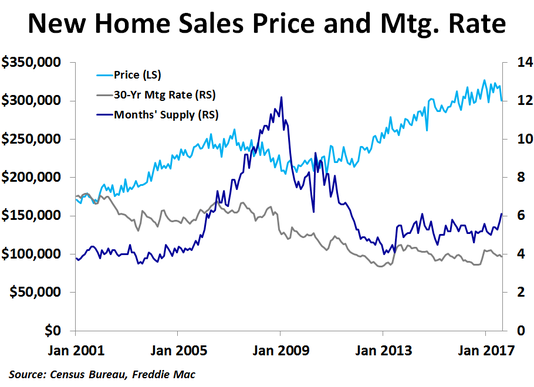
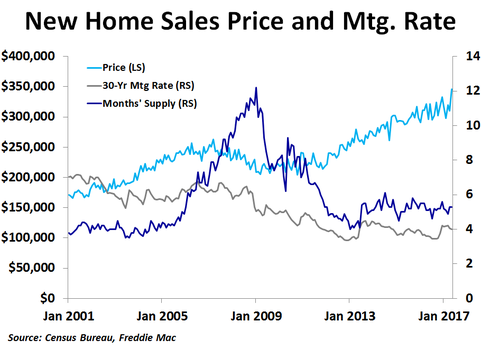
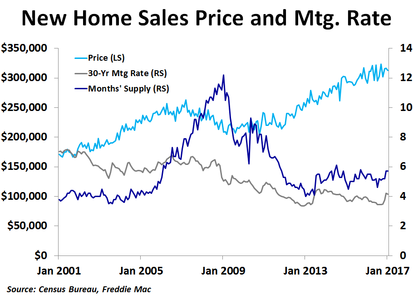
In August, there was 6.1 months’ worth of supply available, a notable increase from July’s 5.7 months and the most since July 2014. An increase in inventory for sale to the highest since May 2009 and a decline in sales both led to the increase in months’ supply. Since 5-6 months’ supply is generally considered a balanced market, the market appears to be in fairly good balance right now. This has helped to keep prices fairly stable recently, albeit still very high. The weakness in sales came despite a third straight month of sub-4% mortgage rates amid political and geopolitical uncertainty and slow inflation.

With inflation still below the Fed’s target of 2.0%, the Fed held rates steady at last week’s FOMC meeting. However, they did give a start date of October to begin reducing their balance sheet. This may push up mortgage rates, but inflation and politics will also be factors. Earlier today Janet Yellen confirmed my opinion that the June rate hike was a mistake.
0 Comments

New Home Sales Fall in July Despite Low Mortgage Rates and Higher Inventories

8/25/2017

1 Comment

 
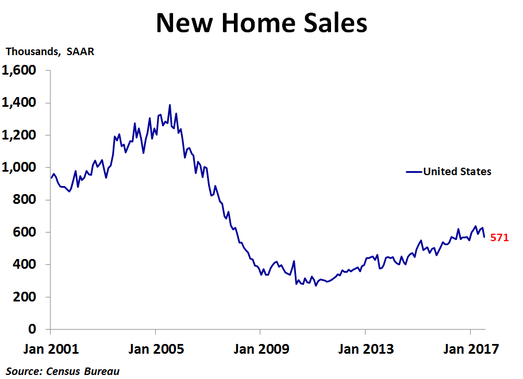
​New home sales fell in July to 571K units on a seasonally adjusted annualized basis, down from 630K units in June, which was revised up from 610K units, less than the consensus forecast of 610K units and the lowest since December 2016. Sales were down 9.4% from June and 8.2% from a year ago.
Picture
The only region where sales rose was in the Midwest, where sales increased 6.2% from the prior month. Sales fell 4.1% in the South, 21.3% in the West and 23.8% in the Northeast. Compared to a year ago, sales were only higher in the West, up a scant 1.4%, while sales were down 10.4% in the South, 12.7% in the Midwest and 13.5% in the Northeast.

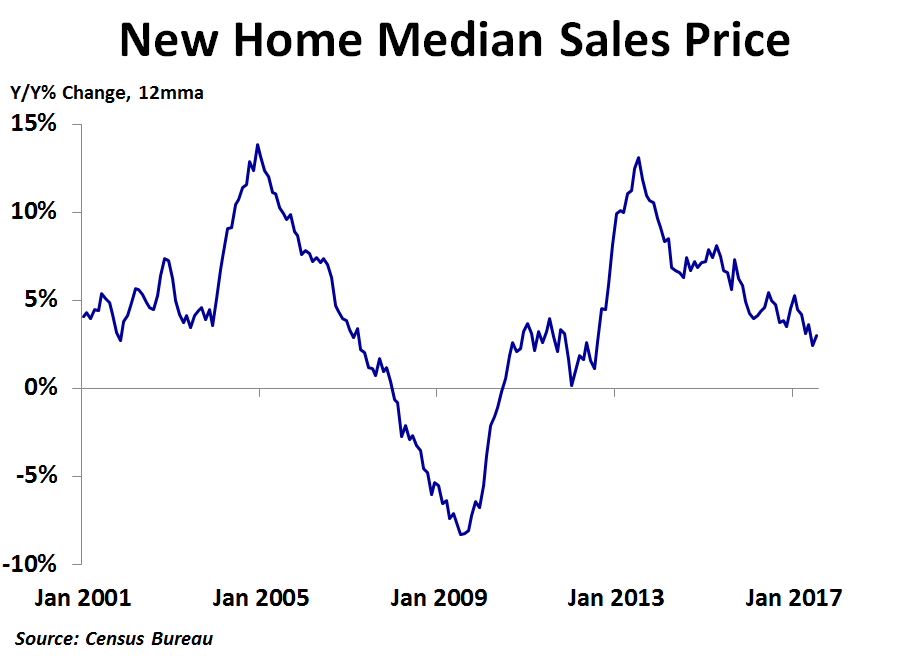
​In the second quarter, the national median price was up 1.8% from the prior year. Prices were up 7.6% in the Midwest and 2.4% in the West, but were down 1.6% in the South and 6.6% in the Northeast. The Census Bureau does not report regional median prices by month, only quarterly and annually. In July, the national median price rose to $313,700, a 0.7% increase from the prior month, following a 3.5% drop in June. Compared to a year ago, the median price was up 6.3%. This was the sixth straight month where the direction of price changes on a year-ago basis was opposite that of the prior month. The 12-month moving average trend of price growth has been slowing over the last couple of years, and in June reached a new cyclical low of 2.4% but bounced back slightly to 3.0% in July. This suggests new home prices may be getting very close to a cyclical peak.  
Picture
As with the existing home market, inventory continues to be a big story right now. In July, there was 5.8 months’ worth of supply available, a notable increase from June’s 5.2 months and the most since September 2015. An increase in inventory for sale to the highest since June 2009 and a decline in sales both led to the increase in months’ supply. Since 5-6 months’ supply is generally considered a balanced market, the market appears to be in fairly good balance right now. This has helped to keep prices fairly stable recently. The weakness in sales came despite a second straight month of sub-4% mortgage rates amid political uncertainty and slowing inflation.

​With inflation slowing and still below the Fed’s target of 2.0%, the Fed held rates steady at July’s FOMC meeting. However, the bigger issue is when the Fed will start to reduce its balance sheet, which may begin in September. This might push up mortgage rates, but inflation and politics will also be factors. 
1 Comment

New Home Sales Rise in June as the Median Price Declines

7/26/2017

0 Comments

 
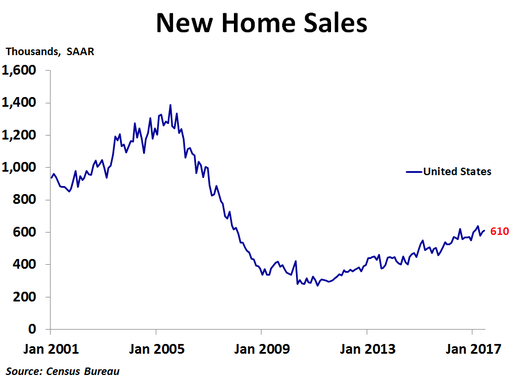
​New home sales rose in June to 610K units on a seasonally adjusted annualized basis, up from 605K units in May, which was revised down from 610K units, and in line with the consensus forecast of 611K units. Sales were up 0.8% from May and 9.3% from a year ago.
Picture
Sales rose 12.5% from the prior month in the West and 10.0% in the Midwest. However, sales were flat in the Northeast and fell 6.1% in the South. Compared to a year ago, sales were up 46.4% in the Northeast, 34.3% in the West and 0.6% in the South, but were down a steep 12.0% in the Midwest.

​In the second quarter, the national median price was up 1.8% from the prior year. Prices were up 7.6% in the Midwest and 2.4% in the West, but were down 1.6% in the South and 6.6% in the Northeast. The Census Bureau does not report regional median prices by month, only quarterly and annually. In June, the national median price fell to $310,800, a 4.2% decline from the prior month, following a notable increase in May. Compared to a year ago, the median price was down 3.4%, the third year-ago decline in the past five months. The 12-month moving average trend of price growth has been slowing over the last couple of years, and in June reached a new cyclical low of 2.4%. This suggests new home prices may be getting close to a cyclical peak. The decline in the median price in June had a lot to do with a change in the mix of homes sold, as sales in the $200K-$299K price range rose while sales in the $300K-$399K price range declined.  
Picture
As with the existing home market, inventory continues to be a big story right now. In June, there was only 5.4 months’ worth of supply available. Although that is up from 5.0 months in March, it is still far below the supply levels of the previous boom and on the low end of the 5-6 month range generally considered a balanced market. Fortunately, the number of new homes for sale has jumped in the last few months and is at the highest level since June 2009. This has helped to keep prices fairly stable recently. In addition, mortgage rates have been trending down over the last few weeks amid political uncertainty and slowing inflation.

​With inflation slowing and still below the Fed’s target of 2.0%, the Fed held rates steady at today’s FOMC meeting. However, the bigger issue is when the Fed will start to reduce its balance sheet, which they said will begin relatively soon. This will likely push up mortgage rates, but inflation will also play a big part.
0 Comments

New Home Sales Rise in May Despite Soaring Prices

6/25/2017

0 Comments

 
​New home sales rose in May to 610K units on a seasonally adjusted annualized basis, up from 593K units in April, which was revised up from 569K units, and well above the consensus forecast of 590K units. Sales were up 2.9% from April and 7.8% from a year ago.
Picture
Sales rose 13.3% from the prior month in the West and 6.2% in the South. However, sales fell 10.8% in the Northwest and plunged 25.7% in the Midwest, the second straight large monthly decline, taking sales to the lowest level in that region since February 2015. Compared to a year ago, sales were up 14.1% in the West, 12.9% in the South and 3.1% in the Northeast. In the Midwest, sales were down 24.7%.

​In the first quarter, the national median price was down 2.2% from the prior year, the first decline since the fourth quarter of 2011. Prices were up a sharp 32.6% in the Northeast and a scant 1.2% in the West, but were down 3.7% in the Midwest and 6.0% in the South. The Census Bureau does not report regional median prices by month, only quarterly and annually. In May, the national median price soared to a record $345,800, an 11.5% jump from the prior month, the largest monthly increase since October 2014. Compared to a year ago, the median price was up 16.8%, the most since September 2015. The 12-month moving average trend of price growth has been slowing over the last couple of years, and despite this measure rising from 3.1% in April to 4.2% in May, the downward trend remains in place, suggesting new home prices may be getting close to a cyclical peak. That being said, the big increase in the median price in May had a lot to do with a change in the mix of homes sold, as there was a big decline in sales in the $200K-$299K price range, while higher priced homes saw an increase in sales. 
Picture
​As with the existing home market, inventory continues to be a big story right now. In May, there was only 5.3 months’ worth of supply available. Although that is up from 4.9 months in March, it is still far below the supply levels of the previous boom. Fortunately, the number of new homes for sale has jumped in the last few months and is at the highest level since July 2009, which has helped to keep prices fairly stable recently. In addition, mortgage rates have been trending down over the last few weeks amid political uncertainty and slowing inflation. With supply and mortgage rates remaining very low, new home prices will likely remain elevated. Buyers would rejoice if high prices lured more supply to the market. 
0 Comments

New Home Sales Plunge, Prices Fall and Inventory Rises in April

5/23/2017

0 Comments

 
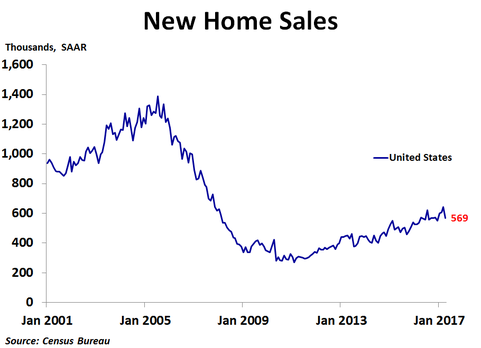
New home sales plunged in April to 569K units on a seasonally adjusted annualized basis, way down from 642K units in March, which was revised up from 621K units, and far below the consensus forecast of 602K units. March sales were the highest since October 2007. Sales were down 11.4% from the prior month and 0.2% from a year ago, the first decline on a year-ago basis since February 2016.
Picture
Sales fell in all four regions, with the biggest decline coming in the West, where sales plunged 26.3%. The Midwest saw a 13.1% drop, while sales fell 7.5% in the Northeast and 4.0% in the South. Compared to a year ago, sales were up 19.7% in the Midwest and 2.8% in the South, while sales were down 7.5% in the Northeast and 13.1% in the West.

​In the first quarter, the national median price was down 2.2% from the prior year, the first decline since the fourth quarter of 2011. Prices were up a sharp 32.6% in the Northeast and a scant 1.2% in the West, but were down 3.7% in the Midwest and 6.0% in the South. The Census Bureau does not report regional median prices by month, only quarterly and annually. In April, the national median price fell 3.0% from the prior month. Compared to a year ago, the median price was down 3.8%, nearly matching the 3.9% drop in February, which was the biggest decline since January 2012. The 12-month moving average trend of price growth has been slowing over the last couple of years and is currently the slowest in nearly five years, suggesting new home prices may be near a cyclical peak. 
Picture
As with the existing home market, inventory continues to be a big story right now. In April, there was only 5.7 months’ worth of supply available. Although that is up from 4.9 months in March, it is still far below the supply levels of the previous boom. Fortunately, the number of new homes for sale has jumped in the last few months and is at the highest level since July 2009, which has helped to keep prices fairly stable recently. Mortgage rates have been trending down over the last few weeks as investors have become more uncertain about the success or impacts of pro-growth policies under the Trump administration. In addition, inflation slowed in April, suggesting interest rates will likely stay fairly low in the near term.

​The trend of home price growth took another step closer to zero in April as it continues to mirror the previous cycle. Falling prices may soon become the new trend, especially if the Fed raises interest rates. 
0 Comments

New Home Sales Soar in March Despite Higher Prices

4/25/2017

0 Comments

 
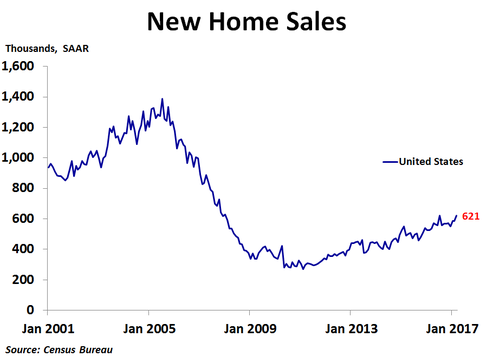
New home sales soared in March to 621K units on a seasonally adjusted annualized basis, an improvement on February’s 587K units, far better than the consensus forecast of 588K units and just shy of the post-recession high of 622K units reached in July 2016. Sales were up a very strong 5.8% from the prior month and 15.6% from a year ago.
Picture
Sales rose the most in the Northeast, which saw a 25.8% increase from the prior month. Sales rose 16.7% in the West and 1.6% in the South, but declined 4.5% in the Midwest. Compared to a year ago, sales were up 32.6% in the West, 23.5% in the Midwest, 21.9% in the Northeast and just 5.9% in the South.

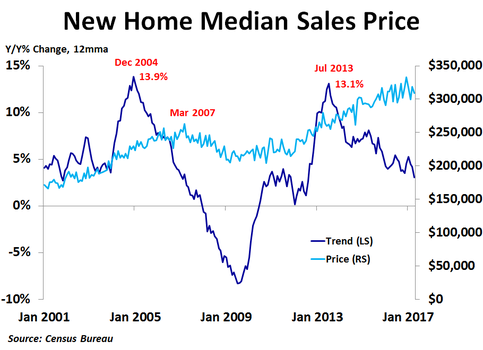
In the first quarter, the national median price was down 2.2% from the prior year, the first decline since the fourth quarter of 2011. Prices were up a sharp 32.6% in the Northeast and a scant 1.2% in the West, but were down 3.7% in the Midwest and 6.0% in the South. The Census Bureau does not report regional median prices by month, only quarterly and annually. In March, the national median price rose 7.5% from the prior month but was up just 1.2% from the prior year. The 12-month moving average trend of price growth has been slowing over the last couple of years and is currently the slowest in four and a half years, suggesting new home prices may be near a peak.
Picture
As with the existing home market, inventory continues to be a big story right now. In March, there was only 5.2 months’ worth of supply available, down from 5.4 months in February, far below the supply levels of the previous boom and not nearly enough to meet torrid demand. Fortunately, the number of new homes for sale has jumped in the last few months and are at the highest level since July 2009, which should bring some relief to frustrated buyers. Mortgage rates have declined noticeably over the last few weeks as investors have become more uncertain about the success or impacts of pro-growth policies under the new administration. In addition, inflation slowed in March, suggesting interest rates may stay fairly low in the near term.

​The path of home price growth during this housing cycle is nearly a mirror image of the path during the last cycle when viewed on a year-over-year percent change, 12-month moving average basis. If supply or mortgage rates move up, prices will likely fall, but big upside movements for either do not appear likely in the near term. 
0 Comments

Lower Prices Lift New Home Sales in February

3/23/2017

0 Comments

 
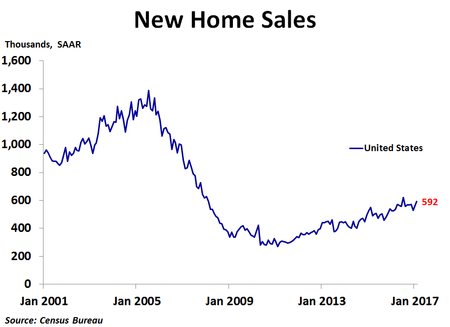
New home sales rose in February to 592K units on a seasonally adjusted annualized basis, an improvement on January’s 558K units, and far better than the consensus forecast of 565K units. Sales were up 6.1% from the prior month and 12.8% from a year ago.
Picture
Sales rose the most in the Midwest, which saw a 30.9% increase from the prior month. Sales rose 7.5% in the West and 3.6% in the South, but declined 21.4% in the Northeast. Compared to a year ago, sales were up a strong 50.8% in the Midwest, 13.8% in the Northeast, 7.9% in the South and 6.8% in the West.

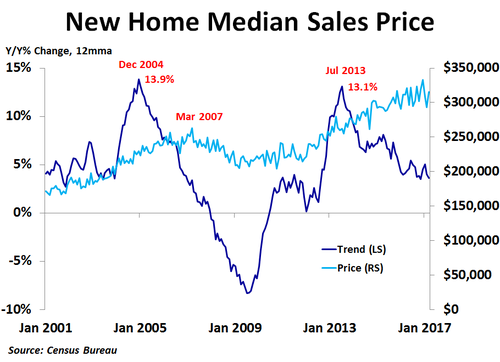
In the fourth quarter, median prices were up 1.6% y/y in the Midwest, but were down 2.0% in the South, 2.5% in the West and 16.7% in the Northeast. The Census Bureau does not report regional median prices by month, only quarterly and annually. The national median price fell 3.9% in February to $296,200. The 12-month moving average trend of price growth has been slowing over the last couple of years, suggesting we may be near a peak in prices for new homes.

​As with the existing home market, inventory continues to be a big story right now. In February, there was only 5.4 months’ worth of supply available. While this is a bit higher than the 5.3 month average over the past year, it is still far below the supply levels of the previous boom, and not enough to meet torrid demand. Fortunately, the number of new homes for sale has jumped in the last few months, which should bring some relief to frustrated buyers. Builders are likely reluctant to ramp up construction too much partly due to the risk of overbuilding and causing another crash, and partly because current demand is being driven by ultra-low mortgage rates, which are not only unsustainable, but have risen since the election. Mortgage rates have levelled of over the last couple months as investors have become more uncertain about the success or impacts of pro-growth policies under the new administration. Still, accelerating inflation suggests interest rate risk is to the upside. 
Picture
​Interestingly, the path of home price growth during this housing cycle is nearly a mirror image of the path during the last cycle when viewed on a year-over-year percent change, 12-month moving average basis. If supply or mortgage rates move up, prices will likely fall. If they both move up, prices could fall significantly. With inflation on the rise and the Fed hinting at further rate hikes, this housing cycle may be reaching its peak. Stay tuned!
Picture
0 Comments

New Home Sales and Supply Rise in January

2/24/2017

0 Comments

 
​New home sales rose in January to 555K units on a seasonally adjusted annualized basis, an improvement on December’s 535K units, but less than the consensus forecast of 576K units. Sales were up 3.7% from the prior month and 5.5% from a year ago.

Picture
By region, sales rose the most in the Northeast, which saw a 15.8% increase from the prior month. Sales rose 14.8% in the Midwest and 4.3% in the South, but declined 4.4% in the West. Compared to a year ago, sales were up a strong 22.2% in the Northeast, 16.2% in the West and 4.5% in the Midwest, but were down 1.0% in the South.

In the fourth quarter, median prices were up 1.6% y/y in the Midwest, but were down 2.0% in the South, 2.5% in the West and 16.7% in the Northeast. The Census Bureau does not report regional median prices by month, only quarterly and annually. Despite the 7.5% y/y increase in the national median price in January, the 12-month moving average trend of price growth has been slowing over the last couple of years, suggesting we may be near a peak in prices for new homes.

​As with the existing home market, inventory continues to be a big story right now. In January, there was only 5.7 months’ worth of supply available. While this is a bit higher than the 5.3 month average over the past year, it is still far below the supply levels of the previous boom, and not enough to meet torrid demand. Fortunately, the number of new homes for sale has jumped in the last couple months, which should bring some relief to frustrated buyers. Builders are likely reluctant to ramp up construction too much partly due to the risk of overbuilding and causing another crash, and partly because current demand is being driven by ultra-low mortgage rates, which are not only unsustainable, but are now on the rise. Rising mortgage rates may be starting to temper demand as mortgage applications have dropped in 3 of the last 4 weeks, so we may be near a turning point in the housing market. 
Picture
​Interestingly, the path of home price growth during this housing cycle is nearly a mirror image of the path of home price growth during the last cycle when viewed on a year-over-year percent change, 12-month moving average basis. If supply or mortgage rates move up, prices will likely fall. If they both move up, prices could fall significantly. With inflation on the rise and the Fed primed to raise interest rates, this low-mortgage-rate-induced housing boom may be coming to an end. Stay tuned! 
Picture
0 Comments

    Archives

    September 2017
    August 2017
    July 2017
    June 2017
    May 2017
    April 2017
    March 2017
    February 2017
    June 2013
    May 2013

    Categories

    All
    Construction Spending
    CPI
    Employment Report
    Existing Home Sales
    GDP
    Housing Market Index
    Import Prices
    Industrial Production
    Leading Economic Indicators
    New Home Sales
    Personal Income And Outlays
    Producer Prices
    Retail Sales
    Small Business Optimism
    Trade

    RSS Feed

Proudly powered by Weebly