Ed Kashmarek - The Everyday Economist
  • Home
  • About
    • Skills
    • Volunteering
    • Music
    • Microfinance
    • Photos
    • Book List
  • Work Samples
  • Reports
  • Blog
  • Charts
  • Podcast
  • Webinars
  • Tableau
    • Employment Analysis Tool (Web)
    • Employment Analysis Tool (Mobile)
    • GDP Analysis Tool (Web)
    • GDP Analysis Tool (Mobile)
    • MN Housing
  • Join Email List
  • Booking

Existing Home Sales Fall in July Despite Declining Prices and Low Mortgage Rates

8/25/2017

0 Comments

 
​Existing home sales fell in July to 5.44 million units on a seasonally adjusted annualized basis, down from June’s 5.51 million units, less than the consensus forecast of 5.57 million units and the lowest reading since last August. Sales were down 1.3% from the prior month but were up 2.1% from a year ago.
Picture
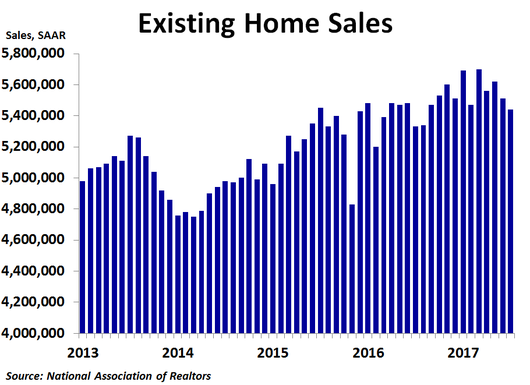
By region, sales increased 5.0% from the prior month in the West and 2.2% in the South, but fell 5.3% in the Midwest and plunged 14.5% in the Northeast. Compared to a year ago, sales were up the most in the West at 5.0% and were up 3.6% in the South. Sales were down 1.5% in the Northeast and 1.6% in the Midwest. For the Midwest, it was the fourth straight month without an increase in sales from the prior year. Median prices were up the most in the West at 7.6% compared to a year ago, while they were up 6.7% in the South, 5.9% in the Midwest and 4.1% in the Northeast. The national median price was up 6.2%, down slightly from June’s 6.3% rate of growth.

​By type, sales were down 0.8% compared to the prior month for single-family homes and down 4.8% for condos and co-ops. On a year-ago basis, sales were up 5.3% for condos and co-ops and just 1.7% for single-family homes. Prices were up 6.3% for single-family homes and 5.3% for condos and co-ops. 
Picture
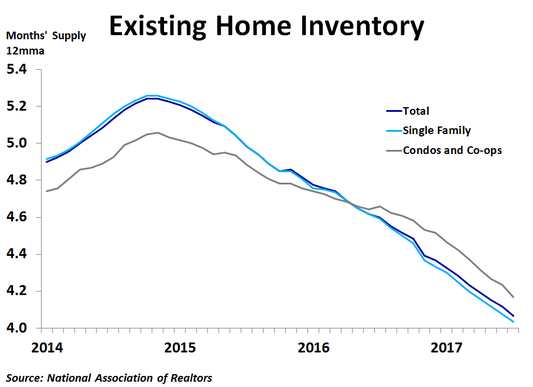
Inventory continues to be a big story right now. In July, inventories fell 1.0%. However, since sales fell a slightly larger 1.3%, the ratio of inventories to sales, or the months’ supply, held steady at 4.2 for the third straight month. The 12-month moving average also held steady at 4.1 months, down significantly from a couple years ago. One big reason that inventories are so low is that some people who bought homes at the peak of the bubble in 2006 still have not recuperated all of their losses. On the other hand, many who would like to upgrade are finding prices too high so they are staying in their current home, preventing others from buying their house and keeping supply limited. What homes do get listed are often scooped up quickly, and sellers are getting multiple offers that in some cases are above the asking price. This suggests we may be getting very close to a cyclical a peak in prices.

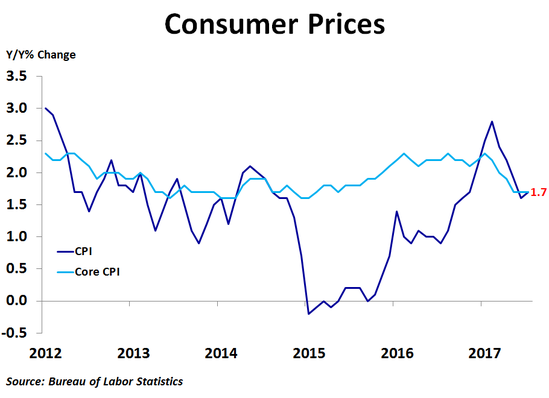
​Sales fell in July despite mortgage rates staying below 4.0% for a second straight month. With inflation below the Fed’s target of 2.0% and political uncertainty weighing on bond yields, mortgage rates remain very favorable. When the Fed starts to trim its balance sheet, mortgage rates could start to rise. Stay tuned! 
0 Comments

New Home Sales Fall in July Despite Low Mortgage Rates and Higher Inventories

8/25/2017

0 Comments

 
​New home sales fell in July to 571K units on a seasonally adjusted annualized basis, down from 630K units in June, which was revised up from 610K units, less than the consensus forecast of 610K units and the lowest since December 2016. Sales were down 9.4% from June and 8.2% from a year ago.
Picture
The only region where sales rose was in the Midwest, where sales increased 6.2% from the prior month. Sales fell 4.1% in the South, 21.3% in the West and 23.8% in the Northeast. Compared to a year ago, sales were only higher in the West, up a scant 1.4%, while sales were down 10.4% in the South, 12.7% in the Midwest and 13.5% in the Northeast.

​In the second quarter, the national median price was up 1.8% from the prior year. Prices were up 7.6% in the Midwest and 2.4% in the West, but were down 1.6% in the South and 6.6% in the Northeast. The Census Bureau does not report regional median prices by month, only quarterly and annually. In July, the national median price rose to $313,700, a 0.7% increase from the prior month, following a 3.5% drop in June. Compared to a year ago, the median price was up 6.3%. This was the sixth straight month where the direction of price changes on a year-ago basis was opposite that of the prior month. The 12-month moving average trend of price growth has been slowing over the last couple of years, and in June reached a new cyclical low of 2.4% but bounced back slightly to 3.0% in July. This suggests new home prices may be getting very close to a cyclical peak.  
Picture
As with the existing home market, inventory continues to be a big story right now. In July, there was 5.8 months’ worth of supply available, a notable increase from June’s 5.2 months and the most since September 2015. An increase in inventory for sale to the highest since June 2009 and a decline in sales both led to the increase in months’ supply. Since 5-6 months’ supply is generally considered a balanced market, the market appears to be in fairly good balance right now. This has helped to keep prices fairly stable recently. The weakness in sales came despite a second straight month of sub-4% mortgage rates amid political uncertainty and slowing inflation.

​With inflation slowing and still below the Fed’s target of 2.0%, the Fed held rates steady at July’s FOMC meeting. However, the bigger issue is when the Fed will start to reduce its balance sheet, which may begin in September. This might push up mortgage rates, but inflation and politics will also be factors. 
0 Comments

Leading Economic Indicators Index Rises as Expected in July

8/17/2017

0 Comments

 
​The leading economic indicators index rose 0.3% in July from the prior month following a 0.6% increase in June. The increase matched the consensus forecast. Compared to a year ago, the index was up 3.9%, slightly less than June’s 4.1% pace. Over the six month period ending in July, the index was up 2.3%, down slightly from the 2.6% rate of growth in the six months ending in June.
Picture
The interest rate spread between the 10-year Treasury yield and the Federal Funds rate led the way in July, contributing 0.13 percentage points to the growth in the index. Although this was the smallest contribution from this component since last August as the spread has narrowed, this component has still contributed the most to the rise in the index over the past six months. The ISM new orders index came in second, contributing 0.10 percentage points as the index remained on the upper end of the recent range in July. Consumer expectations for business conditions contributed 0.09 percentage points, a nice rebound from the weak contribution in June, likely driven by strong job growth. The stock market contributed 0.03 percentage points as the market continued its upward march despite political chaos. Another decline in average weekly jobless claims added 0.02 percentage points. Core capital goods orders and new orders for consumer goods contributed little to the index, while average weekly hours contributed nothing as hours were unchanged.           

​The only negative contribution came from building permits, which took 0.12 percentage points away from growth in the index as permits fell from 1.275 million units at a seasonally adjusted annualized rate in June to 1.223 million units in July. 
Picture
Although the interest rate spread is often among the largest contributors, its contribution has been trending slightly lower over the last few months as the Federal Reserve has been gradually raising the Federal Funds rate while the 10-year Treasury yield has come down as investors’ initial optimism about the new administration’s economic policies has been followed by some doubt about the chances for successful implementation.

​The 10-year Treasury yield has fallen further in August amid rapidly mounting political tensions both here and abroad. It is becoming increasingly clear that Trump is going to have a very difficult time getting his much sought-after pro-business agenda implemented, which bodes ill for stocks and the economy. 
0 Comments

Retail Sales Rise Twice as Much as Expected in July

8/16/2017

0 Comments

 
​Retail sales rose 0.6% in July from the prior month, twice as much as the consensus forecast of a 0.3% increase, following a 0.3% increase in June that was revised up from a 0.2% decline. Sales excluding autos and gas also beat expectations, rising 0.5% compared to expectations of a 0.4% increase. On a year-over-year basis, sales were up 4.2%, better than the 3.6% pace in June but still below the recent peak growth rate of 5.6% reached in January. 
Picture
The biggest monthly increase in dollar terms was a $1.2 billion, or 1.2%, increase in motor vehicles and parts. Non-store sales followed with a $696 million, or 1.3%, increase. Building and garden supply stores took the third spot with a $359 million, or 1.2%, increase. On a percentage basis, the strongest growth was seen in the miscellaneous category, where sales rose 1.8%. The biggest decline in sales came from gasoline stations, where sales fell by $130 million, or 0.4%, as gasoline prices declined. Sales at electronics and appliance stores fell by $43 million, or 0.5%, which was the biggest percentage decline. The only other decline was a $38 million, or 0.2%, drop in clothing sales.

​Sales were higher on a year-over-year basis, led by a $5.3 billion, or 11.2%, increase in non-store sales. Vehicles and parts sales were close behind, up by $5.2 billion, or 5.5%. Building and garden supply stores sales were up by $2.3 billion, or 7.9%. On the downside, sales at sports and hobby stores were down by $282 million, or 3.8%. Department store sales were down by $238 million, or 1.8%, amid a struggle against online competition, while electronics and appliance store sales were down by $85 million, or 1.0%, from the prior year. 
Picture
If we take out the impact of gasoline sales, which are not really an indication of stronger or weaker economic growth but rather due to changing gas prices, ex-gas retail sales were up 4.3% from a year ago in July, the most since January. If we also adjust for inflation, we see that real ex-gas retail sales were up 2.6% in July. Not only was this the best growth since June 2016, but it was strong enough to break out of the two-year-long downward trend, a welcome development for consumer spending.  

​Despite all of the weak May data, the Federal Reserve raised interest rates in June but finally took a breather in July. Today’s retail sales report, along with upward revisions in the last couple months, paints a brighter picture for consumer spending. Even so, inflation remains at bay and wage growth remains tepid. This bodes well for no rate hike in September.
0 Comments

Overall and Core Prices Rise in July but Inflation Remains Below Target

8/11/2017

0 Comments

 
​Consumer prices rose 0.1% in July from the previous month, missing the consensus forecast of a 0.2% increase, following no change in June. Compared to a year ago, prices were up 1.7%, up slightly from June’s 1.6% pace, which was the lowest since October. Core prices, which exclude food and energy, also rose 0.1%, missing the forecast of a 0.2% increase, and were also up 1.7% on a year-ago basis, matching May and June for the slowest rate of year-over-year growth since May 2015.
Picture
Compared to a month ago, prices rose the most for medical care commodities (+1.0%), meats and poultry (+0.7%), airline fares (+0.7%), fruits and vegetables (+0.5%) and hospital services (+0.5%). In a rare occurrence, owners’ equivalent rent of primary residences did not make the top five. Prices fell the most for piped gas service (-2.3%), fuel oil (-2.0%), used cars and trucks (-0.5%), new vehicles (-0.5%) and cereals and bakery products (-0.4%). Gasoline prices were unchanged on the month. Owners’ equivalent rent, medical care and recreation services had the largest positive effects on the price index, while the biggest negative effects came from other lodging away from home, piped gas service and new vehicles.

​Compared to a year ago, prices were up the most for motor vehicle insurance (+7.6%), piped gas service (+7.5%), tobacco and smoking products (+7.1%), hospital services (+5.7%) and rent of primary residence (+3.8%). Gasoline prices were up 3.0% from a year ago, but that is only because prices tumbled last July. Prices were down the most for used cars and trucks (-4.1%), airline fares (-2.5%), physicians’ services (-0.6%), new vehicles (-0.6%) and cereals and bakery products (-0.5%). The biggest positive effects on a year-ago basis came from owners’ equivalent rent, medical care and motor vehicle insurance, while the biggest negative effects came from wireless phone services, used cars and trucks and household furnishings and supplies.
Picture
Even though employment growth was strong in June, the Federal Reserve held the Fed Funds rate steady at its July meeting as wage growth remained subdued and inflation slowed. With inflation still below the Fed’s target of 2.0% for the personal consumption expenditures index, its preferred measure of inflation, it is very likely that the Fed will choose to leave the Fed Funds rate unchanged again in September. Throw in rapidly mounting tensions with North Korea, and the Fed just might remain on the sidelines for the rest of this year. 
0 Comments

Job Growth Strong Again in July as Only One Industry Loses Jobs

8/4/2017

0 Comments

 
​Job growth was strong again in July as the economy added 209K new jobs, a little less than June’s 231K increase but much higher than the 178K consensus forecast. Revisions were negligible. The year-ago rate of job growth slipped to 1.5%, the lowest since May 2011.
Picture
Leisure and hospitality services led the way in July, putting 62K more people to work, mostly in food services and drinking places. Education and healthcare services added 54K new positions, with 45K of them coming from healthcare. Professional and business services also had a strong month as 49K people found new jobs, 15K of which were in temporary help services. Manufacturing had a decent month as 16K more people were hired. Wholesale trade added 6K more people to staff. The construction industry had a fairly weak month as only 6K new jobs were created. In the last five months construction has only added 28K new jobs amid a slowdown in home building. Financial services also had a weak month, with only 6K new positions being filled. Information services added 4K new people to the payrolls, the second straight gain following eight months of losses totaling 62K jobs. This is good news as these are among the highest paid jobs in the economy. Government added just 4K new jobs following a surge in June. Following four months of losses, the retail industry has created 3K new jobs in the past two months; not much, but at least jobs are being created. Following eight straight months of gains, mining and logging employment was flat in July.  

​The only industry that lost jobs in July was utilities, and even that was a mild decline of just 900 positions. The fact that only one industry lost jobs in July goes to show how strong today’s report really is. 
Picture
The 22K decline in job growth in July versus June was largely due to much less hiring in government and fewer jobs being created in other services and healthcare.

Even though 349K people entered the labor force in July, the unemployment rate fell from 4.4% to 4.3% as 345K of them found jobs, a remarkable 99% success rate!  

Average hourly earnings rose 0.3% and were up 2.5% from a year ago for the fourth straight month. With inflation cooling recently, real wage growth has rebounded slightly but remains very weak at just 0.9%.

​Today’s report may give the hawks more incentive to push for another Fed rate hike soon. Even so, inflation remains well below the Fed’s target, so a rate hike is not necessary. 
0 Comments

Personal Income Flat in June, Spending Rises Slightly

8/3/2017

0 Comments

 
Personal income was flat in June compared to May, much less than the consensus forecast of a 0.4% increase, and was up 2.6% from a year ago. Personal spending rose just 0.1%, matching the consensus forecast, and was up 4.1% from a year ago, the slowest rate of growth since August. The personal savings rate fell slightly to 3.8%.
Picture
Compared to a month ago, rental income led the way with a 0.6% increase. Wages and salaries followed with a 0.4% increase, with both private and government wages rising at about the same rate. Personal current transfer receipts rose 0.2% as veterans’ benefits rose 1.2% and unemployment insurance increased 1.1%, the first increase since December. On the downside, proprietors’ income slipped 0.1% as farm income fell for the third straight month. Personal income receipts on assets plunged 1.8% as dividend income fell 3.0% following a big 4.8% jump in May.

Compared to a year ago, rental income topped the charts, up 5.5%, as high home prices are pushing up rents. Personal current transfer receipts were up 3.1%, led by a sharp 6.1% increase in veterans’ benefits. Wages and salaries were up 2.5%, with private and government wages up by pretty much the same percentage. Proprietors’ income was up 2.2% as non-farm income was up 3.6% while farm income was down 40.1%. Income on assets was up just 2.0%, driven largely by interest income.

Wages and salaries accounted for just under half of the total increase in personal income on a year-ago basis, most of which came from private industry wages. On a month-ago basis, wages and salaries rose by $30.9 billion, but that was more than offset by the $43.8 billion decline in income on assets.

​The growth rate of personal tax payments slowed to 2.5% from a year ago, leaving disposable income up 2.6%. After factoring in inflation, real personal disposable income growth dipped from 1.4% to 1.2%, and real spending slowed from 3.0% to 2.7%. 
Picture
​With inflation and real income and spending growth slowing, the Federal Reserve’s decision to leave the Fed Funds rate unchanged at last week’s FOMC meeting looks like a wise decision. In fact, there really was no reason to raise it in June either, but they did. They may now be regretting that move. The market has certainly changed its tune as Treasury yields have declined after the late June spike. The market is telling the Fed that inflation is not a concern. The Fed should listen. 
0 Comments

Construction Spending Plunges in June and the Weakness is Widespread

8/3/2017

0 Comments

 
​According to the Commerce Department, total construction spending plunged by $15.8 billion, or 1.3%, in June to $1.21 trillion, widely missing the consensus forecast of a 0.5% increase. This follows a 0.3% increase in May that was revised up from no change. Compared to a year ago, spending was up just 1.6%, the least since November 2011. 
Picture
Weakness was widespread in June. Residential spending fell by $1.4 billion, or 0.3%, from the prior month but was up 9.0% from the prior year. Non-residential spending plunged by $14.4 billion, or 2.0%, and was down 3.1% from the prior year, the worst in four years.

For non-residential spending, only two of fifteen categories saw spending increases. Spending on office projects rose by $1.4 billion, or 1.9%, and spending on communications projects rose by $612 million, or 2.8%. Every other category saw spending fall, led by a huge $5.7 billion, or 6.4%, decline in spending on highways and streets, which took the level of spending down to the lowest in over three years. Other notable declines were a $3.9 billion, or 4.3%, decline in education spending and a $1.2 billion, or 1.8%, decline in manufacturing. The biggest percentage declines came in conservation and development, where spending dropped 7.3%, and public safety, where spending fell 6.5% from the prior month.                 

​Private spending only fell by $573 million, or 0.1%, with all of the decline coming from residential projects. Although non-residential spending rose by $503 million, or 0.1%, that included a $1.8 billion, or 2.9%, increase in spending on office projects and a $1.3 billion, or 1.9%, decrease in manufacturing. Meanwhile, public spending cratered by $15.2 billion, or 5.4%, half of which came from just two categories, with highway and street projects falling by $5.8 billion, or 6.6%, and education spending dropping by $3.9 billion, or 5.5%. Thus, 94% of the drop in total  spending came from public non-residential projects.  
Picture
Compared to a year ago, the strongest growth in total construction spending has come from residential, office and commercial projects. Conversely, the biggest declines have been seen in conservation/development, sewage and waste disposal and water supply.

​Last week the Federal Reserve held the Fed Funds rate steady. Today’s very weak report suggests that was a wise move. With inflation slowing, Treasury yields and mortgage rates have been trending down, which should help to support the construction industry. 
0 Comments

    Archives

    September 2017
    August 2017
    July 2017
    June 2017
    May 2017
    April 2017
    March 2017
    February 2017
    June 2013
    May 2013

    Categories

    All
    Construction Spending
    CPI
    Employment Report
    Existing Home Sales
    GDP
    Housing Market Index
    Import Prices
    Industrial Production
    Leading Economic Indicators
    New Home Sales
    Personal Income And Outlays
    Producer Prices
    Retail Sales
    Small Business Optimism
    Trade

    RSS Feed

Proudly powered by Weebly