Ed Kashmarek - The Everyday Economist
  • Home
  • About
    • Skills
    • Volunteering
    • Music
    • Microfinance
    • Photos
    • Book List
  • Work Samples
  • Reports
  • Blog
  • Charts
  • Podcast
  • Webinars
  • Tableau
    • Employment Analysis Tool (Web)
    • Employment Analysis Tool (Mobile)
    • GDP Analysis Tool (Web)
    • GDP Analysis Tool (Mobile)
    • MN Housing
  • Feedback
  • Join Email List
  • Booking

Personal Income Rises While Spending Misses the Mark in February

3/31/2017

0 Comments

 
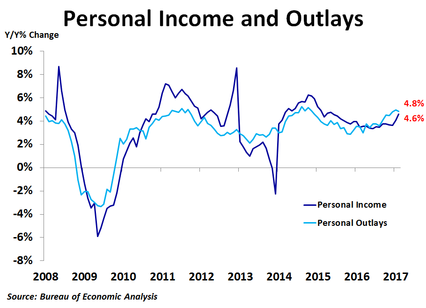
​Personal income rose 0.4% in February from the prior month, matching the consensus forecast, and was up 4.6% from a year ago, the strongest growth since May 2015. Personal spending rose just 0.1%, less than the 0.2% forecast, but was up 4.8% from a year ago, down slightly from January’s 4.9% pace, which was the strongest growth since November 2014. As income grew faster than spending, the personal savings rate inched up to 5.6%.
Picture
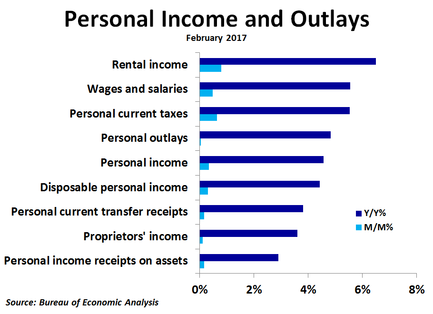
Compared to a month ago, rental income led the way with a 0.8% increase. The all-important wages and salaries component increased by 0.5%. Income on assets, such as interest and dividends, was up 0.2% as interest income rose while dividend income declined.
Personal current transfer receipts, such as Social Security, Medicare, Medicaid and unemployment insurance, also rose 0.2%, as Medicare payments increased while unemployment insurance payments fell again. Proprietors’ income rose just 0.1%.

Compared to a year ago, rental income also topped the charts, rising by a very strong 6.5%, as high home prices are pushing up rents. Wages and salaries were up 5.5%, with private industry wage growth of 6.0% far outpacing government wage growth of just 3.4%. Personal current transfer receipts were up 3.8%, with the strongest growth coming from Medicaid at 5.6%, while unemployment insurance was down 9.4%. Proprietors’ income was up just 3.6%, weighed down by a huge 51% drop in farm income. Income on assets was up just 2.9%, driven almost entirely by interest income.

​Wages and salaries accounted for over half of the total increase in personal income on both a monthly and yearly basis in February, which mostly came from private industry wages. Rental income and supplements to wages and salaries, such as for pension and social insurance, each accounted for 10% of the monthly increase in income. Personal current transfer receipts only accounted for 8% of the increase in income in February after accounting for almost half of the increase in January. 
Picture
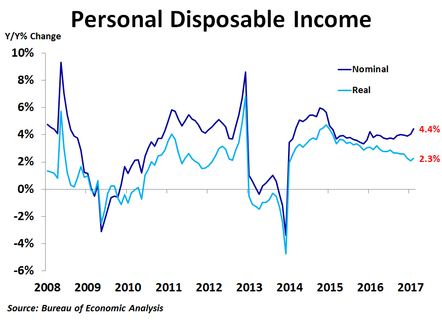
​Despite a big 5.5% increase in tax payments from the prior year, personal disposable income was up 4.4% from a year ago, the best since early 2015. However, real personal disposable income was up just 2.3% and the rate of growth has been slowing for two years. With inflation expected to accelerate in the coming months, real economic growth may not be too impressive, especially if a Fed rate increase starts to weigh on the housing market. 
Picture
0 Comments

Lower Prices Lift New Home Sales in February

3/23/2017

0 Comments

 
New home sales rose in February to 592K units on a seasonally adjusted annualized basis, an improvement on January’s 558K units, and far better than the consensus forecast of 565K units. Sales were up 6.1% from the prior month and 12.8% from a year ago.
Picture
Sales rose the most in the Midwest, which saw a 30.9% increase from the prior month. Sales rose 7.5% in the West and 3.6% in the South, but declined 21.4% in the Northeast. Compared to a year ago, sales were up a strong 50.8% in the Midwest, 13.8% in the Northeast, 7.9% in the South and 6.8% in the West.

In the fourth quarter, median prices were up 1.6% y/y in the Midwest, but were down 2.0% in the South, 2.5% in the West and 16.7% in the Northeast. The Census Bureau does not report regional median prices by month, only quarterly and annually. The national median price fell 3.9% in February to $296,200. The 12-month moving average trend of price growth has been slowing over the last couple of years, suggesting we may be near a peak in prices for new homes.

​As with the existing home market, inventory continues to be a big story right now. In February, there was only 5.4 months’ worth of supply available. While this is a bit higher than the 5.3 month average over the past year, it is still far below the supply levels of the previous boom, and not enough to meet torrid demand. Fortunately, the number of new homes for sale has jumped in the last few months, which should bring some relief to frustrated buyers. Builders are likely reluctant to ramp up construction too much partly due to the risk of overbuilding and causing another crash, and partly because current demand is being driven by ultra-low mortgage rates, which are not only unsustainable, but have risen since the election. Mortgage rates have levelled of over the last couple months as investors have become more uncertain about the success or impacts of pro-growth policies under the new administration. Still, accelerating inflation suggests interest rate risk is to the upside. 
Picture
​Interestingly, the path of home price growth during this housing cycle is nearly a mirror image of the path during the last cycle when viewed on a year-over-year percent change, 12-month moving average basis. If supply or mortgage rates move up, prices will likely fall. If they both move up, prices could fall significantly. With inflation on the rise and the Fed hinting at further rate hikes, this housing cycle may be reaching its peak. Stay tuned!
Picture
0 Comments

Existing Home Sales Fall in February

3/22/2017

0 Comments

 
​Existing home sales fell in February to 5.48 million units on a seasonally adjusted annualized basis, less than January’s 5.69 million units and less than the consensus forecast of 5.55 million units. Sales were down 3.7% from the prior month but up 5.4% from a year ago, besting January’s 3.8% growth rate. 
Picture
By region, sales rose 1.3% from the prior month in the South. Sales fell in all the other regions, including a 3.1% decline in the West, a 7.0% drop in the Midwest and a 13.8% plunge in the Northeast. Compared to a year ago, sales were up a strong 9.6% in the West, 5.9% in the South, 2.6% in the Midwest and 1.5% in the Northeast. Median prices were up the most in the West and the South at 9.6% compared to a year ago, while they were up 6.1% in the Midwest and 4.5% in the Northeast. 

By type, sales fell 3.0% from January for single-family homes and plunged 9.2% for condos and co-ops. On a year-ago basis, sales were up 5.8% for single-family homes and 1.7% for condos and co-ops. Prices were up 8.2% from a year earlier for condos and co-ops and 7.6% for single-family homes. Inventory was down 10.6% y/y for condos and co-ops and down 11.6% y/y for single-family homes.  

​Inventory continues to be the big story right now. In February, there was only 3.8 months’ worth of supply available. While that was a slight up-tick from January, the 12-month moving average was just 4.3 months, down significantly from a couple years ago. One big reason that inventories are so low is that some people who bought homes at the peak of the bubble in 2006 still have not recuperated all of their losses, so they are reluctant to sell, choosing instead to wait for prices to go even higher. In addition, an improving economy has helped to open up job opportunities for many people, some of whom had to move. Thus, it could be that many people simply don’t want to or need to sell their home, even though prices have reached pre-crash peaks in some places.

Picture
​Although mortgage rates were largely unchanged in February, the lagged effects of the big jump after the presidential election may be starting to take root. February’s sales miss could also be payback for a very strong January. Where the market goes from here will largely depend on the success or failure of the new administration to follow through on promises of pro-growth policies, which have been the catalyst for a jump in confidence, as well as higher interest rates. With prices already high, higher rates will likely weigh on housing.
0 Comments

February Leading Economic Indicators Index Points to Stronger Growth Ahead

3/17/2017

0 Comments

 
​The leading economic indicators index rose 0.6% in February from the prior month following a similar 0.6% increase in January. The increase was better than the 0.4% consensus forecast. Compared to a year ago, the index was up a solid 2.5%, an improvement over January’s 1.9% pace. Over the six month period ending in February, the index was up 2.3% after growing just 1.6% in the six months to January.
Picture
The big story in today’s report was the large negative contribution from building permits, which subtracted 0.19 percentage points from the overall index and was the only negative contribution. Building permits slid to 1.21 million in February from January’s 1.29 million, although housing starts rose sharply.

The biggest positive contribution came from the interest rate spread between the 10-year Treasury yield and the Federal Funds rate, which contributed 0.20 percentage points to the index. Although the interest rate spread is often among the largest contributors, its contribution has been trending higher over the last several months as investors have been selling bonds in anticipation of higher inflation and stronger economic growth supported by lower taxes, fewer regulations and heavy infrastructure spending under President Trump. The ISM new orders index also contributed 0.20 percentage points as the recent strength in manufacturing survey data continued. The ISM contribution to the overall index has been noticeably stronger in the last three months. Still, the contribution from actual non-defense orders excluding aircraft has been fairly weak during this same period. Initial jobless claims contributed 0.16 percentage points as claims averaged 237K per week in February, down from January’s 248K. A further rise in the stock market contributed 0.09 percentage points. The same indicators that contributed the most over the past month have also contributed the most to the index over the past six months.
Picture
​Over the past year, only the leading credit index has seen deterioration, while all other components have been improving. The strongest contributor recently has been the widening interest rate spread, which should help to boost lending as banks see wider interest margins on their loan products. This should help to lift overall economic activity. Still, it depends on how much demand there will be for loans. With manufacturing improving and job growth strong, the economy should find firmer ground soon; should being the operative word as productivity remains woefully weak.
Picture
0 Comments

Industrial Production Flat in February

3/17/2017

0 Comments

 
Industrial production was flat in February, weaker than the consensus forecast of 0.2% growth, as a 0.5% increase in manufacturing production and a 2.7% increase in mining production were offset by a 5.7% decline in utilities production as warm weather led to a reduction in natural gas and electricity usage. Overall production was up just 0.3% y/y.
Picture
Production in February was led by a strong 2.7% increase in mining amid a rebound in commodity prices and gradual improvements in the economy. This helped to expand mining employment during the month, which is good news since these jobs are well-paid.

In manufacturing, production was led by a 1.4% increase in paper and a 1.3% increase in plastics and rubber products. On the downside, electrical equipment, appliances and components fell 1.5%, furniture and related products fell 1.4% and textiles fell 1.4%.          
Utilities had a very poor month as natural gas distribution plunged 12.9%, while electric power generation, transmission and distribution fell 5.0%. As a result, the industry lost 1,000 jobs in February, the second straight month of job losses. Since these are also highly paid jobs, losing these jobs is bad news.

Compared to a year ago, production was up the most for machinery, having risen 5.1% since last February. Computer and electronic products were up 5.0%, while wood products were up 3.7%. Conversely, the worst performance was in natural gas distribution, which was down 10.6%, and electric power generation, transmission and distribution, which was down 6.7% from a year ago.
Picture
Capacity utilization slid from 75.5% to 75.4%, down from a recent peak of 78.9% back in November 2014. This has helped to keep inflation largely subdued outside of energy for the last two years. However, the utilization rate has stopped falling since reaching a recent low of 74.9% in March of last year, and has been fairly stable since then. The most pressure is currently seen in nonmetallic mineral mining and quarrying, where 95.8% of capacity is in use. Oil and gas extraction and plastic minerals utilization is also high, at 95.7% and 89.8%, respectively. On the flip side, support activities for mining are only using 39.1% of capacity.  

​Survey data for manufacturing has been quite strong recently, and that optimism is finally showing up in real activity. A few more months of real data will clarify whether manufacturing has truly turned the corner. More business-friendly policies should help.
Picture
0 Comments

Retail Sales Growth Slows in February

3/15/2017

0 Comments

 
Retail sales rose 0.1% in February from the prior month, in line with expectations, but far less than the 0.6% increase in January. Sales excluding autos rose 0.2%, also in line with expectations, while sales excluding autos and gas rose 0.2%, slightly less than expected. On a year-over-year basis, sales were up 5.7%, down slightly from January’s 6.0% pace.
Picture
Non-store sales rose the most in dollars from the prior month, increasing by $610 million, or 1.2%, as purchasing online continues to be a more common way to shop. Building and garden supply stores led the way on a percentage basis, as sales rose $561 million, or 1.8%. Health stores and furniture stores were the only other categories to see monthly gains. The biggest decline in dollars came from gasoline sales, which fell $236 million, or 0.6%. Close behind was a $234 million drop in sales of electronics and appliances, which saw the biggest percentage drop of 2.9%. Vehicles and parts also had a weak month as sales fell $197 million, or 0.2%.

​Sales were higher on a year-over-year basis, led by a $6.0 billion, or 19.6%, increase in gasoline station sales. Non-store sales were a close second with a $5.7 billion, or 13.0%, rise in sales. The largest dollar decline in sales was seen in department stores, where sales were down $751 million, or 5.6%. The biggest percentage decline was in electronics and appliances, where sales were down $514 million, or 6.0%. Thus, while lower gasoline sales were a major factor in weak overall sales in February, they were a big factor in the yearly increase. At the same time, electronics and appliance store sales were weak on both a month-ago and a year-ago basis. 
Picture
If we take out the large impact of gasoline sales, which are not really an indication of stronger economic growth but rather due to higher gas prices, ex-gas retail sales were up only 4.6% from a year ago in February. If we also adjust for inflation, we see that real ex-gas retail sales were up only 1.8% in February. This measure of retail sales growth, which went negative a year before the headline number leading up to the Great Recession, has been trending down over the last two years.

​Just as the Fed looks at prices excluding gasoline to determine the underlying trend of inflation, doing the same thing for retail sales gives us a better look at the underlying trend of retail sales. With this measure of sales growing slower, today’s rate increase may a bigger thorn than many think.
0 Comments

Consumer Prices Rise in February, Year-over-Year Pace Accelerates

3/15/2017

0 Comments

 
Consumer prices rose 0.1% in February from the previous month, in line with expectations, but far less than the 0.6% jump in January. Compared to a year ago, prices were up 2.8%, up from January’s 2.5% pace. Core prices, which exclude food and energy, rose 0.2%, also in line with expectations, and were up 2.2% on a year-over-year basis.
Picture
Compared to a month ago, prices rose the most for airline fares (+2.4%), non-alcoholic beverages and materials (+1.5%), piped gas service (+1.5%), dairy and related products (+0.8%) and electricity (+0.8%). Prices fell the most for gasoline (-3.0%), used cars and trucks (-0.6%), fuel oil (-0.4%), cereals and bakery products (-0.4%) and medical care commodities (-0.2%). Thus, while air travel became more expensive, road travel became less expensive. While the 0.3% rise in owners’ equivalent rent of primary residence didn’t crack the top five, it did account for 60% of the overall increase in the price index when the category weight, which is the largest, is taken into account.

Compared to a year ago, prices were up the most for gasoline (+30.7%), fuel oil (+28.0%), piped gas service (+10.9%), motor vehicle insurance (+7.6%) and hospital services (+4.3%). Prices were down the most for fruits and vegetables (-4.7%), used cars and trucks (-4.3%), meats and poultry (-3.3%), airline fares (-1.1%) and cereals and bakery products (-1.1%). Thus, on a year-ago basis, energy has pushed the price index higher while food and vehicles have pushed the index lower. The biggest contributions to the rise in the index on a year-ago basis came from owners’ equivalent rent of primary residence and gasoline, together comprising almost 2/3 of the increase.
Picture
​The noticeable acceleration of inflation over the last several months, along with a quickening pace of wage growth, led the Federal Reserve to raise the Federal Funds rate range to 0.75%-1.00% today. While the move was widely anticipated, it did not come without some questions. One of the biggest sources of confusion is why the Fed is raising rates even though they only expect 2.0% economic growth over the next couple of years, a forecast which has not changed much recently. In addition, while wages are rising, the pace of growth is fairly gradual and remains far slower than wage growth prior to the recession. Despite these concerns, with inflation measures at or above the Fed’s target, they felt it was necessary to raise rates now to prevent faster tightening down the road, which could cause a recession. 
0 Comments

Employment Growth Much Stronger Than Expectations in February

3/10/2017

0 Comments

 
​Job growth was strong again in February as the economy generated 235K new jobs, down slightly from the 238K increase in January, but far above the 200K consensus forecast. The rate of job growth held at 1.6% year-over-year for the fourth straight month.
Picture
Construction had a monster month, adding 58K new jobs, the most in ten years, most likely due to warmer than normal weather. Professional and business services followed with 37K new positions. Healthcare services had another good month, putting 33K more people to work. Following a loss of 5K jobs in January, education services bounced back with a 29K increase in February. Manufacturing also had a very good month as 28K workers were added to the payrolls, the most in over five years. This was likely the result of expectations for more business friendly policies under President Donald Trump, as well as some deals already made. Mining and logging added 9K jobs as well, the fourth straight monthly increase, which is good news since these jobs are on the higher end of the pay scale. Transportation and warehousing had a nice turnaround, adding 9K jobs after cutting 10K positions in January. Financial services had a weak month, adding just 7K new jobs after adding 32K jobs the month before.

On the downside, by far the biggest disappointment in today’s report is the massive 26K decline in retail trade employment, the biggest drop since December 2012, as many big box retailers are trimming staff in the wake of greater competition from online sales.

​The unemployment rate ticked down to 4.7% from 4.8% as household employment jumped by 447K while only 340K people entered the labor force, meaning the increase in the labor force was fully absorbed, while 107K people who were already in the labor force, but were not working, also found jobs.

Picture
Average hourly earnings rose 0.2% and were up 2.8% from a year ago, a slight increase from the 2.6% pace in January. However, with inflation moving up recently, real wage growth has cratered and was completely flat in January.

​The stock market rose mildly early after today’s report as rising employment and wages portend stronger consumer spending, but also higher labor costs. The Fed is expected to raise the Fed Funds rate by a quarter point next week as inflation continues to accelerate. Higher rates could put a dent in the housing and vehicle markets, which may offset any lift from more business-friendly economic policies. 
0 Comments

Trade Deficit Widens Substantially in January

3/7/2017

0 Comments

 
The U.S. trade deficit widened substantially in January to $48.5 billion from $44.3 billion as exports rose by $1.1 billion, while imports surged by $5.3 billion. Compared to a year ago, exports were up 7.4% and imports were up 8.3%, both of which were the strongest rates of growth in the last five years.
Picture
The increase in exports was led by a $2.1 billion rise in industrial supplies and materials, the bulk of which came from petroleum products and crude oil. Automotive vehicles, parts and engines also saw strong growth of $1.3 billion, mostly from cars. Exports of foods, feeds and beverages rose by $594 million, driven largely by soybeans. Exports of capital goods plunged by $1.9 billion thanks to big declines in exports of civilian aircraft and engines. Consumer goods exports were virtually flat as strong pharmaceutical exports were offset by a drop in exports of gems and jewelry.  

The surge in imports was driven by a $2.4 billion jump in consumer goods, nearly half of which came from cell phones and other household goods. Industrial supplies and materials imports rose by $1.0 billion, led by crude oil and petroleum products. Imports of automotive vehicles, parts and engines rose by $899 million, while semi-conductors and aircraft parts drove a $668 million increase in capital goods imports. Imports of foods, feeds and beverages fell a by scant $57 million.

​The biggest contributions to the change in the deficit in January came from capital goods and consumer goods. Consumer goods accounted for half of the trade deficit in goods in January, while automotive vehicles and parts accounted for a quarter of the deficit.
Picture
Regionally, the big story in today’s report is a $1.6 billion decline in exports to China. Combined with a $1.9 billion increase in imports from China, trade with China accounted for a third of the non-seasonally adjusted $10.3 billion increase in the goods deficit in January. Trade with Canada, South Korea and Saudi Arabia also contributed to the widening of the deficit. Trade with China accounted for nearly half of the level of the deficit in January.

​Although the trade deficit widened in January, it was due to very strong imports, suggesting robust demand from U.S. consumers and businesses. The swift appreciation of the dollar over the last few months has also contributed to the widening imbalance. However, with the dollar taking a breather since the beginning of the year, we may see a slight narrowing of the deficit in the coming months. 
Picture
0 Comments

Construction Spending Plunges in January

3/2/2017

1 Comment

 
​According to the Commerce Department, total construction spending fell by $11.8 billion, or 1.0%, in January to $1.18 trillion, although spending was still very close to the peak seen before the recession. Compared to a year ago, spending was up just 3.1%, on the lower end of the range of the last couple years.  
Picture
There was a noticeable difference in spending between residential and non-residential spending. While residential spending rose $1.4 billion, or 0.3%, from the prior month, non-residential spending plunged by $13.2 billion, or 1.9%. These measures were up 5.5% and 1.5% compared to a year ago, respectively.

Non-residential spending weakness was led by a $2.9 billion decline in spending on highways and streets, a $2.7 billion drop in transportation and a $2.3 billion decline in education. The only real bright spots were a $1.5 billion increase in spending on power and a $354 million increase in manufacturing.

​There was also a noticeable difference between private and public spending. Private spending rose by $2.3 billion, driven exclusively by residential projects. Non-residential spending fell by $139 million, but within that was a $1.2 billion increase in spending on power and a $402 million increase in manufacturing. In contrast, public spending plunged by $14.1 billion, almost all of which came in the non-residential category.  Public spending on highways and streets fell by $2.9 billion, transportation spending dropped by $2.5 billion and spending on education declined by $1.9 billion. The only real strength in the public sector came from spending on power and amusement and recreation projects.

Picture
Compared to a year ago, the strongest growth in total construction spending has come from lodging, office and commercial projects. On the flip side, the biggest declines have been seen in sewage and waste disposal, transportation and public safety projects.

​The residential sector of the U.S. economy has been a pillar of strength over the last several years. This has helped to soften the blow from weaker government spending during the same period. Even so, the pace of residential spending growth has slowed from a peak of nearly 23% year-over-year two years ago to just 5.5% in January. With mortgage rates on the rise and home price growth slowing, we may be near the peak of this housing cycle. Spending on other projects will need to fill the void to support the economy if residential spending softens.           
Picture
1 Comment
<<Previous

    Archives

    September 2017
    August 2017
    July 2017
    June 2017
    May 2017
    April 2017
    March 2017
    February 2017
    June 2013
    May 2013

    Categories

    All
    Construction Spending
    CPI
    Employment Report
    Existing Home Sales
    GDP
    Housing Market Index
    Import Prices
    Industrial Production
    Leading Economic Indicators
    New Home Sales
    Personal Income And Outlays
    Producer Prices
    Retail Sales
    Small Business Optimism
    Trade

    RSS Feed

Proudly powered by Weebly