Ed Kashmarek - The Everyday Economist
  • Home
  • About
    • Skills
    • Volunteering
    • Music
    • Microfinance
    • Photos
    • Book List
  • Work Samples
  • Reports
  • Blog
  • Charts
  • Podcast
  • Webinars
  • Tableau
    • Employment Analysis Tool (Web)
    • Employment Analysis Tool (Mobile)
    • GDP Analysis Tool (Web)
    • GDP Analysis Tool (Mobile)
    • MN Housing
  • Feedback
  • Join Email List
  • Booking

Personal Income and Spending Rise as Expected in April

5/30/2017

0 Comments

 
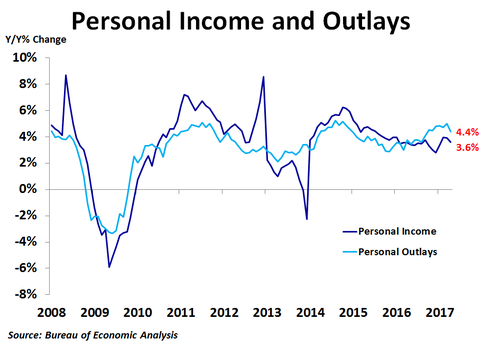
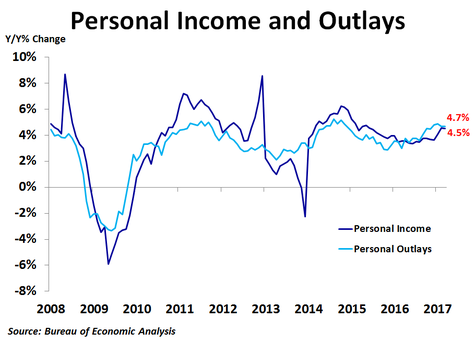
​Personal income rose 0.4% in April from the prior month, matching the consensus forecast, and was up 3.6% from a year ago. Personal spending also rose 0.4%, matching the consensus forecast, and was up 4.4% from a year ago, the slowest rate of growth since September. As income and spending grew at the same rate, the personal savings rate held at 5.3% for the third consecutive month.
Picture
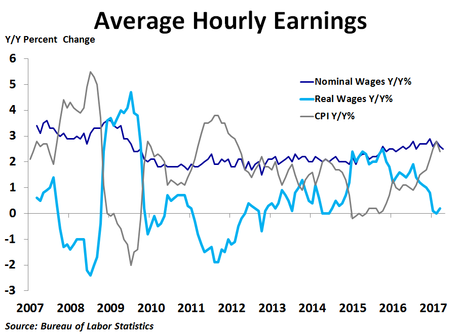
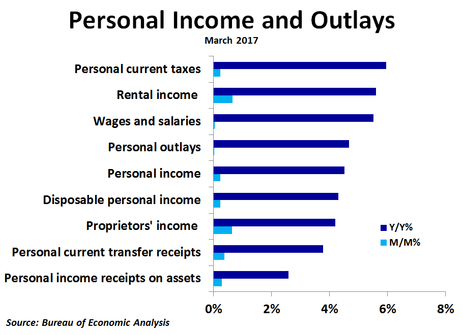
Compared to a month ago, rental income led the way again with a 0.9% increase. Wages and salaries followed with a 0.7% increase, driven by a 0.8% rebound in private industry wages after no change in March. Personal current transfer receipts were flat as social security payments rose just 0.1% while veterans’ benefits dipped and unemployment insurance plunged. Personal income receipts on assets fell 0.1% as an increase in dividend income was offset by a decline in interest income as interest rates fell during the month. Proprietors’ income declined 0.2% as both farm and non-farm income dropped on the month.

​Compared to a year ago, rental income also topped the charts, rising by a very strong 6.9%, as high home prices are pushing up rents. Proprietors’ income was up 3.9% as non-farm income was up 5.0% while farm income was still down 44.1%. Wages and salaries were up 3.7%, with private industry wage growth slipping to 3.7% to almost match government wage growth of 3.5%. Personal current transfer receipts were up 3.6%, with the strongest growth coming from Medicaid at 5.1%, while unemployment insurance was down 9.6%. Income on assets was up just 2.4%, driven primarily by interest income.
Picture
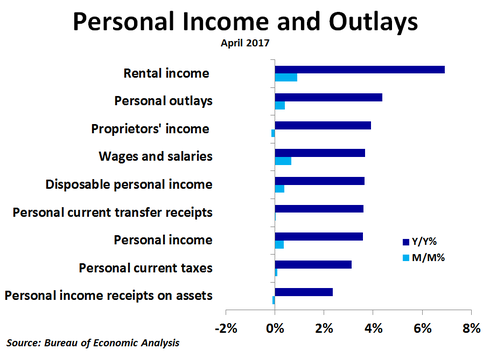
Wages and salaries accounted for just over half of the total increase in personal income on a year-ago basis, most of which came from private industry wages. However, wages and salaries accounted for nearly all of the increase on a month-ago basis, with the vast majority coming from private industry wages. Personal current transfer receipts saw the second highest contribution to yearly growth but only contributed 2% of monthly growth, most of which came from Medicare.

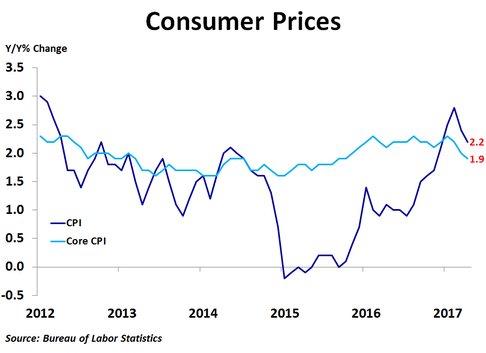
​The growth rate of personal tax payments slowed to 3.1% from a year ago, leaving disposable income up 3.7%. After factoring in inflation, real personal disposable income growth dipped from 2.0% to 1.9%, and real spending slowed from 3.1% to 2.7%. With inflation and real income and spending slowing, a Fed rate hike in June is looking less likely. 
0 Comments

Existing Home Sales Fall in April as Supply Remains Low While Price Growth Cools

5/24/2017

0 Comments

 
​Existing home sales fell in April to 5.57 million units on a seasonally adjusted annualized basis, down from March’s 5.70 million units and less than the consensus forecast of 5.65 million units. Sales were down 2.3% from the prior month and up 1.6% from a year ago, much less than March’s 5.8% pace. 
Picture
By region, sales increased 3.8% from the prior month in the Midwest, the only region to see gains. Sales declined 2.7% in the Northeast, 3.3% in the West and 5.0% in the South. While pullbacks were not a surprise for the Northeast and the South following big increases in March, the decline in the West came after a weak March and was the third drop in a row. Compared to a year ago, sales were up a strong 3.6% in the South and 3.5% in the West, but were down 0.7% in the Midwest and 2.7% in the Northeast. Median prices were up the most in the South at 7.9% compared to a year ago, while they were up 7.8% in the Midwest, 6.8% in the West and just 1.6% in the Northeast. The national median price was up 6.0%, down from March’s 6.9% rate of growth.

​By type, sales fell 1.6% from March for condos and co-ops and 2.4% for single-family homes. On a year-ago basis, sales were up 1.6% for both single-family homes and condos and co-ops. Prices were up 6.1% for single-family homes and 5.6% for condos and co-ops. 
Picture
Inventory continues to be a big story right now. In April, inventories jumped 7.2%, typical for this time of year. This, combined with the slowdown in sales, pushed the supply up to 4.2 months. Even so, the 12-month moving average held steady at 4.2 months, down significantly from a couple years ago. One big reason that inventories are so low is that some people who bought homes at the peak of the bubble in 2006 still have not recuperated all of their losses. What homes do get listed are often scooped up quickly, and sellers are getting multiple offers that in some cases are above the asking price. This suggests a market top in prices may be near as buyers will likely not overbid for homes for too long. Indeed, the year-over-year rate of price growth is slowing in every region except for the Midwest.

​Today’s report is in line with weakness seen in housing starts and new home sales for April. The good news is that mortgage rates have been trending down over the last couple months amid increased political uncertainty, which should boost housing as we head into the summer. The bad news is that the Fed seems ready to hike interest rates again. Stay tuned!
0 Comments

New Home Sales Plunge, Prices Fall and Inventory Rises in April

5/23/2017

0 Comments

 
New home sales plunged in April to 569K units on a seasonally adjusted annualized basis, way down from 642K units in March, which was revised up from 621K units, and far below the consensus forecast of 602K units. March sales were the highest since October 2007. Sales were down 11.4% from the prior month and 0.2% from a year ago, the first decline on a year-ago basis since February 2016.
Picture
Sales fell in all four regions, with the biggest decline coming in the West, where sales plunged 26.3%. The Midwest saw a 13.1% drop, while sales fell 7.5% in the Northeast and 4.0% in the South. Compared to a year ago, sales were up 19.7% in the Midwest and 2.8% in the South, while sales were down 7.5% in the Northeast and 13.1% in the West.

​In the first quarter, the national median price was down 2.2% from the prior year, the first decline since the fourth quarter of 2011. Prices were up a sharp 32.6% in the Northeast and a scant 1.2% in the West, but were down 3.7% in the Midwest and 6.0% in the South. The Census Bureau does not report regional median prices by month, only quarterly and annually. In April, the national median price fell 3.0% from the prior month. Compared to a year ago, the median price was down 3.8%, nearly matching the 3.9% drop in February, which was the biggest decline since January 2012. The 12-month moving average trend of price growth has been slowing over the last couple of years and is currently the slowest in nearly five years, suggesting new home prices may be near a cyclical peak. 
Picture
As with the existing home market, inventory continues to be a big story right now. In April, there was only 5.7 months’ worth of supply available. Although that is up from 4.9 months in March, it is still far below the supply levels of the previous boom. Fortunately, the number of new homes for sale has jumped in the last few months and is at the highest level since July 2009, which has helped to keep prices fairly stable recently. Mortgage rates have been trending down over the last few weeks as investors have become more uncertain about the success or impacts of pro-growth policies under the Trump administration. In addition, inflation slowed in April, suggesting interest rates will likely stay fairly low in the near term.

​The trend of home price growth took another step closer to zero in April as it continues to mirror the previous cycle. Falling prices may soon become the new trend, especially if the Fed raises interest rates. 
0 Comments

Leading Economic Indicators Index Rises As Expected in April

5/18/2017

0 Comments

 
​The leading economic indicators index rose 0.3% in April from the prior month following a downwardly revised 0.3% increase in March. The increase matched the consensus forecast. Compared to a year ago, the index was up 2.4%, less than March’s 2.7% pace. Over the six month period ending in April, the index was up 2.4%, up slightly from the 2.3% rate of growth in the six months to March.
Picture
The interest rate spread between the 10-year Treasury yield and the Federal Funds rate led the way in April, contributing 0.16 percentage points to the growth in the index. Although this is the smallest contribution from this component since October as the spread has narrowed, this component has still contributed the most to the rise in the index over the past six months. Jobless claims contributed 0.10 percentage points in April as average weekly claims fell to 243,000 from 250,200 in a sign of continued labor market strength. Consumer expectations of business conditions added 0.08 percentage points in the fifth straight solid month for this component. Average weekly hours contributed 0.07 percentage points as weekly hours rose slightly during the month. Following four very strong months, the ISM new orders index cooled and only added 0.04 percentage points. Recent strength in this component finally showed up in real production data for April as reported yesterday, so this pullback suggests real manufacturing activity could cool as we head into the early Fall.         

The biggest negative contribution came from building permits, which took 0.07 percentage points away from growth in the index as permits fell to 1.229 million units on an annualized basis in April from 1.260 million units in March. The stock market took away 0.01 percentage points as the S&P 500 fell to 2,359 from 2,367 amid rising political chaos and uncertainty emanating from the White House.
Picture
Although the interest rate spread is often among the largest contributors, its contribution has been trending slightly lower over the last few months as investors have been turning back to bonds as initial optimism about the new administration’s economic policies has been followed by some doubt about the chances for successful implementation and the possible impacts on the economy and earnings.

​First quarter GDP growth was a very weak 0.7%, which was predicted by the stalling in the LEI  in the second half of last year. The rise in the LEI over the last few months suggests that growth should pick up by the summer. 
0 Comments

Industrial Production Surges and Capacity Utilization Rises in April

5/17/2017

0 Comments

 
Industrial production jumped 1.0% in April, more than double the 0.4% consensus forecast and much better than March’s 0.4% increase, which was revised down from 0.5%. The increase was led by a 1.2% rise in mining, followed closely by a 1.0% rise in manufacturing and a 0.7% rise in utility output. It was a rare month when all three major categories saw increases in production. Overall production was up 2.2% on a year-ago basis, the strongest rate of growth since January 2015.
Picture
In manufacturing, production was led by a 5.0% spike in production of motor vehicles and parts, but this was after a big 3.6% decline in March. Petroleum and coal products production rose 2.5% and electric power generation, transmission and distribution rose 2.1%. On the downside, natural gas distribution plunged 9.5% following a 24.3% jump in March, production of non-metallic mineral products fell 1.0% and aerospace and  transportation equipment production fell 0.7%.           

Compared to a year ago, production was up 7.3% for mining and 7.0% for petroleum and coal products. Conversely, the worst performance was in natural gas distribution, which was down 10.7%, apparel and leather goods, production of which was down 4.7%, and aerospace and transportation equipment, production of which was down 3.1%.

​Capacity utilization increased from 76.1% to 76.7%, but was still below the recent peak of 79.2% back in November 2014. This has helped to keep inflation largely subdued outside of energy for the last two years. The utilization rate has been fairly steady since reaching a recent low of 75.4% in March 2016, but April’s reading is a bit of a breakout from the recent trend. The most pressure is currently seen in oil and gas extraction, where 96.4% of capacity is in use. Nonmetallic mineral mining and quarrying and plastic materials and resin utilization is also high, at 91.1% and 89.4%, respectively. On the flip side, support activities for mining are only using 52.1% of capacity.  
Picture
​Survey data for manufacturing has been quite strong recently, but that strength had not shown up in actual production data until April. That being said, since April’s strength was largely due to the rebound in motor vehicle and parts production, we will have to see if that strength continues into May to determine if manufacturing activity is truly gaining momentum. Recent political turmoil is pushing interest rates down, which should help to support sales and production of motor vehicles.
0 Comments

Retail Sales Rise Less Than Expected in April

5/12/2017

0 Comments

 
Retail sales rose 0.4% in April from the prior month, missing the consensus forecast of a 0.6% increase, following a 0.1% increase in March, which was revised up from a 0.2% decline. Sales excluding autos and gas also missed expectations, rising just 0.3% versus the 0.4% forecast. On a year-over-year basis, sales were up 4.5%, down noticeably from the recent peak of 5.6% reached in January.
Picture
Vehicles and parts sales rose the most in dollars from the prior month, increasing by $720 million, or 0.7%. Non-store sales came in a close second, rising by $709 million, or 1.4%, as purchasing online continues to be a more common way to shop. Building and garden store sales followed with a $381 million increase. Non-store sales led the way on a percentage basis, followed closely by electronics and appliances (+1.3%) and building and garden stores (+1.2%). The biggest decline in dollars came from general merchandise store sales, which fell by $304 million, or 0.5%. Grocery store sales followed with a $223 million, or 0.4%, decline, while food and beverage sales fell by $161 million, or 0.3%. Furniture and clothing also saw 0.5% declines.

​Sales were higher on a year-over-year basis, led by a $5.5 billion, or 11.9%, increase in non-store sales. Gasoline sales were a close second with a $4.2 billion, or 12.3%, rise in sales, followed by a $4.1 billion, or 4.4%, increase in vehicles and parts sales . Thus, non-store sales and vehicles and parts were major drivers in sales on both a month-ago and year-ago basis. The largest dollar decline in sales was seen in department stores, where sales were down $478 million, or 3.7%, which was also the biggest percentage decline of any category. This is also taking a toll on department store stocks as earnings continue to disappoint investors.   
Picture
If we take out the impact of gasoline sales, which are not really an indication of stronger or weaker economic growth but rather due to changing gas prices, ex-gas retail sales were up only 3.8% from a year ago in April. If we also adjust for inflation, we see that real ex-gas retail sales were up just 1.6% in April, the same as in March. This measure of retail sales growth, which went negative a year before the headline number leading up to the Great Recession, has been trending down over the last two years and remained weak in April.

​This report, along with slowing wage growth and overall and core inflation in April, may once again give the Fed some pause at its next rate setting meeting in June. Stay tuned!
0 Comments

Consumer Prices Rise in April but the Rate of Inflation Has Slowed

5/12/2017

0 Comments

 
​Consumer prices rose 0.2% in April from the previous month, matching the consensus forecast, following a 0.3% drop in March. Compared to a year ago, prices were up 2.2%, down from March’s 2.4% pace. Core prices, which exclude food and energy, rose 0.1%, missing the forecast of a 0.2% increase, and were up 1.9% on a year-over-year basis, the lowest since October 2015.
Picture
Compared to a month ago, prices rose the most for tobacco and smoking products (+4.2%), fruits and vegetables (+2.2%), piped gas service (+2.2%), gasoline (+1.2%) and hospital services (+1.0%). Prices fell the most for physicians’ services (-1.2%), medical care commodities (-0.8%), airline fares (-0.6%), meats and poultry (-0.6%) and used cars and trucks (-0.5%). Thus, while air travel became less expensive, road travel became more expensive. Owners’ equivalent rent accounted for a quarter of the overall increase in prices, while gasoline accounted for one-fifth of the increase. The biggest negative contributions to the index came from physicians’ services, medicinal drugs and men’s apparel.

​Compared to a year ago, prices were up the most for fuel oil (+22.1%), gasoline (+14.3%), piped gas service (+12.0%), tobacco and smoking products (+7.7%) and motor vehicle insurance (+6.7%). Prices were down the most for used cars and trucks (-4.6%), meats and poultry (-3.0%), cereals and bakery products (-0.8%), airline fares (-0.6%) and nonalcoholic beverages (-0.2%). Thus, on a year-ago basis, energy has pushed the price index higher while food and vehicles have pushed the index lower. The biggest contributions to the rise in the index on a year-ago basis came from owners’ equivalent rent of primary residence and gasoline, together accounting for over half of the overall increase in the index. 
Picture
​Although job growth bounced back in April, today’s inflation report, along with a slight slowdown in wage growth and weaker than expected retail sales growth, point to the possibility that the Fed may hold off again at its next meeting in June. Although a June rate hike seemed like it was almost a certainty after the jobs report, the lowest core inflation rate in a year and a half suggests the Fed has a bit more wiggle room than thought a week ago. There appears to be a little inflation in the pipeline for producers in the early stages of the supply chain, so we’ll need to watch that. Inflation, retail sales and political uncertainty will likely keep interest rates near current levels in May. 
0 Comments

Job Growth Rebounds and the Unemployment Rate Falls in April

5/5/2017

0 Comments

 
​Job growth rebounded in April as the economy generated 211K new jobs, up significantly from the 79K increase in February, and much better than the 185K consensus forecast. Revisions showed 13K more jobs were created in February and 19K fewer in March than previously reported. The rate of job growth inched up to 1.6% year-over-year.
Picture
Leading the way in April was a strong 55K increase in leisure and hospitality services, half of which came from food services and drinking places. However, this came after a very weak March for the sector. Professional and business services were next, adding 39K new jobs. Healthcare services saw a 37K increase in staff, though again this followed the weakest month since December 2013. Financial activities had a decent month, adding 19K new jobs after dismal readings in February and March. Following a scant 2K rise in March, government payrolls rose by 17K, driven exclusively by local government. Mining and logging had another good month, putting 10K more people to work, bringing the running six month total increase to 45K. This is very good news as these are high paying jobs. Importantly, retail trade added 6K jobs, the first increase in three months after losing 56K jobs during February and March.  

The only real downside in the report  was a 7K decline in information services employment, the seventh straight decline and the sector’s worst slump since the recession.

The 132K difference in job growth in April versus March was largely due to strong hiring in leisure and hospitality services and sharp rebounds in retail trade and healthcare.

More good news was a decline in the unemployment rate from 4.5% to 4.4% as the 156K gain in household employment far outpaced the small 12K increase in the labor force, meaning the increase in the labor force was fully absorbed, while 144K people who were already in the labor force, but were not previously working, also found new jobs.
Picture
Average hourly earnings rose 0.3% and were up 2.5% from a year ago, down a bit from the 2.9% pace back in December. With inflation moving up recently, real wage growth has cratered and was virtually flat in March.

​Very weak GDP growth in the first quarter and slowing job growth and inflation in March led the Fed to hold rates steady on Wednesday. Even so, the Fed believes the recent weakness will likely not last. Today’s job report has bumped up the odds of a rate hike in June, but, as always, inflation will be key. 
0 Comments

Construction Spending Falls in March as Non-residential Weakness Overshadows Residential Strength

5/3/2017

0 Comments

 
​According to the Commerce Department, total construction spending fell by $2.5 billion, or 0.2%, in March to $1.22 trillion, but remained above the peak reached before the recession. Compared to a year ago, spending was up just 3.6%, a noticeable slowdown from February’s 5.4% rate of growth and on the lower end of the growth range seen during the last couple of years. 
Picture
There was a noticeable difference in spending between the residential and non-residential sectors. While residential spending rose by $5.9 billion, or 1.2%, from the prior month, non-residential spending plunged by $8.4 billion, or 1.2%. These measures were up 7.3% and 1.0% compared to a year ago, respectively.

Non-residential spending strength was led by a $693 million increase in spending on healthcare facilities, a $436 million increase in manufacturing and a $402 million increase in highways and streets. Weakness was led by a $3.2 billion plunge in educational facilities, a $2.8 billion drop in commercial buildings and a $1.9 billion decline in office buildings.               

There was also a noticeable difference between private and public spending. Private spending rose by $126 million, driven almost exclusively by residential projects. Non-residential spending fell by $5.9 billion and the weakness was fairly widespread. In contrast, public spending fell by $2.6 billion, almost all of which came in the non-residential category.  Public spending on non-residential projects fell by $2.5 billion, driven largely by a $1.4 billion pullback in spending on educational facilities and a $1.2 billion decline in transportation.
Picture
Compared to a year ago, the strongest growth in total construction spending has come from communications, office and commercial projects. Conversely, the biggest declines have been seen in sewage and waste disposal, water supply and transportation projects.

​The residential sector of the U.S. economy has been a pillar of strength over the last several years. This has helped to soften the blow from weaker government spending during the same period. Even so, the pace of residential spending growth is down from a peak of nearly 23% year-over-year two years ago to just 7.3% in March. Following very weak economic growth in the first quarter and a decline in the consumer price index in March, the Federal Reserve held interest rates steady at today’s FOMC meeting. This should help to keep residential spending strong.
0 Comments

Personal Income Growth Slows While Personal Spending Stagnates in March

5/3/2017

0 Comments

 
​Personal income rose 0.2% in March from the prior month, less than the consensus forecast of 0.3%, and was up 4.5% from a year ago. Personal spending was flat for the second straight month, missing the 0.1% forecast, but was up 4.7% from a year ago, matching February’s pace but down slightly from January’s 4.9% pace, which was the strongest growth since November 2014. As income grew faster than spending, the personal savings rate inched up to 5.9% from 5.7%.
Picture
Compared to a month ago, rental income led the way with a 0.7% increase. Proprietors’ income followed with a 0.6% increase. Personal current transfer receipts rose 0.4% as social security payments rose 0.8% while unemployment insurance dropped 1.4%. Personal income receipts on assets rose 0.3%, almost all of which came from interest income. The all-important wages and salaries component increased by just 0.1% as government wages and salaries rose by 0.2% while private wages and salaries were flat.

Compared to a year ago, rental income also topped the charts, rising by a very strong 5.6%, as high home prices are pushing up rents. Wages and salaries were up 5.5%, with private industry wage growth of 5.9% far outpacing government wage growth of just 3.5%. Proprietors’ income was up 4.2% as non-farm income was up 5.4% while farm income was down 47%. Personal current transfer receipts were up 3.8%, with the strongest growth coming from veterans’ benefits at 5.2%, while unemployment insurance was down 9.0%. Income on assets was up just 2.6%, driven almost entirely by interest income.
Picture
Wages and salaries accounted for over half of the total increase in personal income on a year-ago basis, most of which came from private industry wages. However, wages and salaries accounted for only a tenth of the increase on a month-ago basis, most of which came from government wages. Personal current transfer receipts saw the second highest contribution to yearly growth but the highest contribution to monthly growth, most of which came from social security payments.

​A big 6.0% increase in tax payments from the prior year knocked the growth rate of personal disposable income down to 4.3% from 4.4%. However, real personal disposable income growth increased to 2.4% from 2.2% thanks to a decline in prices in March. This should help to support second quarter economic growth after a dismal first quarter. 
0 Comments

    Archives

    September 2017
    August 2017
    July 2017
    June 2017
    May 2017
    April 2017
    March 2017
    February 2017
    June 2013
    May 2013

    Categories

    All
    Construction Spending
    CPI
    Employment Report
    Existing Home Sales
    GDP
    Housing Market Index
    Import Prices
    Industrial Production
    Leading Economic Indicators
    New Home Sales
    Personal Income And Outlays
    Producer Prices
    Retail Sales
    Small Business Optimism
    Trade

    RSS Feed

Proudly powered by Weebly