Existing home sales fell in June to 5.52 million units on a seasonally adjusted annualized basis, down from May’s 5.62 million units and less than the consensus forecast of 5.58 million units. Sales were down 1.8% from the prior month and up just 0.7% from a year ago, the lowest year-ago increase since August.
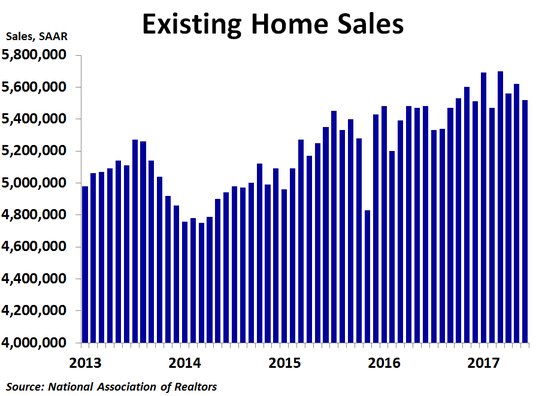
By region, sales increased 3.1% from the prior month in the Midwest, the only region to see an increase in sales in June. The rebound in the Midwest in June was not a surprise since sales in May were very weak. Elsewhere, sales fell 0.8% in the West, 2.6% in the Northeast and 4.7% in the South. Compared to a year ago, sales were up the most in the West at 2.5% and up 1.3% in the Northeast. Sales were flat compared to a year ago in the South and the Midwest. Median prices were up the most in the Midwest at 7.7% compared to a year ago, while they were up 7.4% in the West, 6.2% in the South and 4.1% in the Northeast. The national median price was up 6.5%, up from May’s 5.7% rate of growth and the first increase in the year-ago rate of growth in four months.
By type, sales were flat compared to the prior month for condos and co-ops and down 2.0% for single-family homes. On a year-ago basis, sales were up 1.6% for condos and co-ops and 0.6% for single-family homes. Prices were up 6.6% for single-family homes and 6.5% for condos and co-ops.
By type, sales were flat compared to the prior month for condos and co-ops and down 2.0% for single-family homes. On a year-ago basis, sales were up 1.6% for condos and co-ops and 0.6% for single-family homes. Prices were up 6.6% for single-family homes and 6.5% for condos and co-ops.
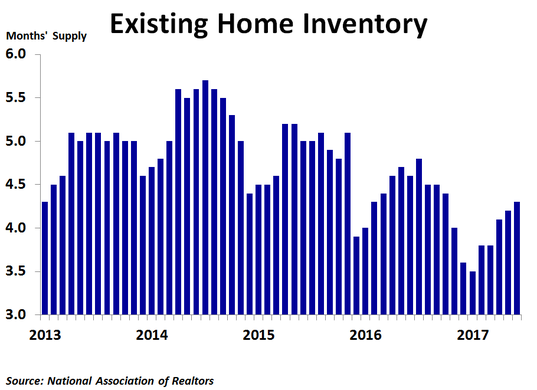
Inventory continues to be a big story right now. In June, inventories fell 0.5%. However, since sales fell a larger 1.8%, the ratio of inventories to sales, or the months’ supply, rose from 4.2 to 4.3. Even so, the 12-month moving average slipped a few decimal points to 4.1 months, down significantly from a couple years ago. One big reason that inventories are so low is that some people who bought homes at the peak of the bubble in 2006 still have not recuperated all of their losses. On the other hand, many who would like to upgrade are finding prices too high so they are staying in their current home, preventing others from buying their house and keeping supply limited. What homes do get listed are often scooped up quickly, and sellers are getting multiple offers that in some cases are above the asking price. This suggests a peak in prices may be near.
Sales fell in June despite a decline in mortgage rates. On Wednesday, the Federal Reserve is expected to provide more details on the plan to reduce its balance sheet, which could push mortgage rates higher. The real estate market would be well advised to tune in.
Sales fell in June despite a decline in mortgage rates. On Wednesday, the Federal Reserve is expected to provide more details on the plan to reduce its balance sheet, which could push mortgage rates higher. The real estate market would be well advised to tune in.
 RSS Feed