Existing home sales rose in May to 5.62 million units on a seasonally adjusted annualized basis, up from April’s 5.56 million units and more than the consensus forecast of 5.55 million units. Sales were up 1.1% from the prior month and up 2.7% from a year ago, slightly better than April’s 1.5% pace.
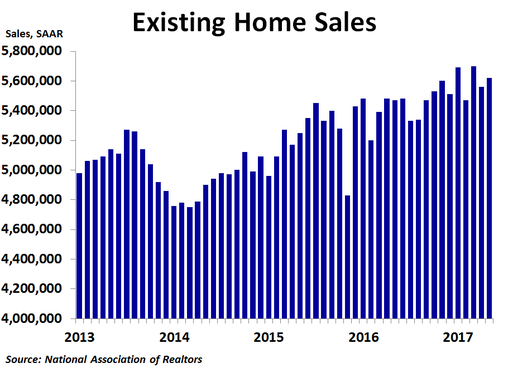
By region, sales increased 6.8% from the prior month in the Northeast, by far the strongest growth of all regions. Sales rose 3.4% in the West and 2.2% in the South. The Midwest had a very bad month, as sales plunged 5.9%, but this followed a strong April for the region, while all other regions saw declines in April. Compared to a year ago, sales were up a strong 4.5% in the South, 3.4% in the West and 2.6% in the Northeast, but were down 0.8% in the Midwest. Median prices were up the most in the Midwest at 7.3% compared to a year ago, while they were up 6.9% in the West, 5.3% in the South and 4.7% in the Northeast. The national median price was up 5.8%, down from April’s 6.1% rate of growth. It was the third straight drop in the year-ago rate of growth.
By type, sales rose 1.6% from April for condos and co-ops and 1.0% for single-family homes. On a year-ago basis, sales were up 3.2% for condos and co-ops and 2.7% for single-family homes. Prices were up 6.0% for single-family homes and 4.8% for condos and co-ops.
By type, sales rose 1.6% from April for condos and co-ops and 1.0% for single-family homes. On a year-ago basis, sales were up 3.2% for condos and co-ops and 2.7% for single-family homes. Prices were up 6.0% for single-family homes and 4.8% for condos and co-ops.
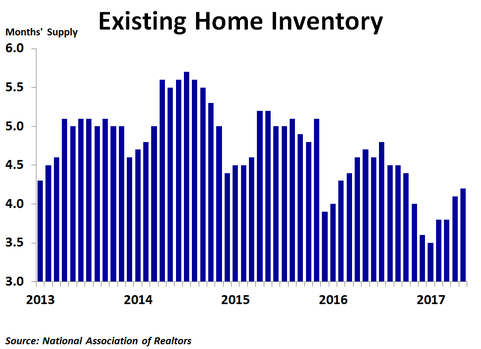
Inventory continues to be a big story right now. In May, inventories rose 2.1%. However, since sales rose a smaller 1.1%, the ratio of inventories to sales, or the months’ supply, rose from 4.1 to 4.2. Even so, the 12-month moving average held steady at 4.2 months, down significantly from a couple years ago. One big reason that inventories are so low is that some people who bought homes at the peak of the bubble in 2006 still have not recuperated all of their losses. What homes do get listed are often scooped up quickly, and sellers are getting multiple offers that in some cases are above the asking price. This suggests a market top in prices may be near as buyers will likely not overbid for homes for too long. Indeed, the year-over-year rate of price growth is slowing in the South and West and appears to be close to a peak in the Midwest.
Today’s report is welcome relief after a terrible April for the housing market. With mortgage rates trending down over the last couple months, a rebound for housing was expected. Still, May continued a recent pattern of ups and downs for sales. If the recent pattern holds, June may be another down month.
Today’s report is welcome relief after a terrible April for the housing market. With mortgage rates trending down over the last couple months, a rebound for housing was expected. Still, May continued a recent pattern of ups and downs for sales. If the recent pattern holds, June may be another down month.
 RSS Feed