Existing home sales fell in April to 5.57 million units on a seasonally adjusted annualized basis, down from March’s 5.70 million units and less than the consensus forecast of 5.65 million units. Sales were down 2.3% from the prior month and up 1.6% from a year ago, much less than March’s 5.8% pace.
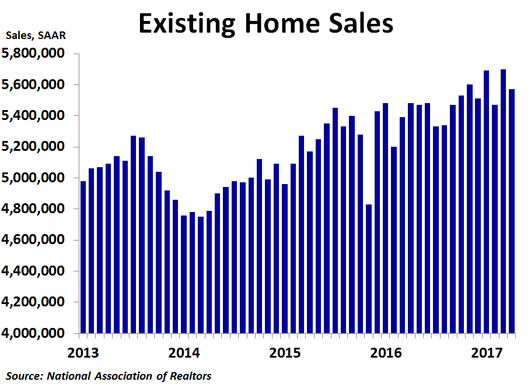
By region, sales increased 3.8% from the prior month in the Midwest, the only region to see gains. Sales declined 2.7% in the Northeast, 3.3% in the West and 5.0% in the South. While pullbacks were not a surprise for the Northeast and the South following big increases in March, the decline in the West came after a weak March and was the third drop in a row. Compared to a year ago, sales were up a strong 3.6% in the South and 3.5% in the West, but were down 0.7% in the Midwest and 2.7% in the Northeast. Median prices were up the most in the South at 7.9% compared to a year ago, while they were up 7.8% in the Midwest, 6.8% in the West and just 1.6% in the Northeast. The national median price was up 6.0%, down from March’s 6.9% rate of growth.
By type, sales fell 1.6% from March for condos and co-ops and 2.4% for single-family homes. On a year-ago basis, sales were up 1.6% for both single-family homes and condos and co-ops. Prices were up 6.1% for single-family homes and 5.6% for condos and co-ops.
By type, sales fell 1.6% from March for condos and co-ops and 2.4% for single-family homes. On a year-ago basis, sales were up 1.6% for both single-family homes and condos and co-ops. Prices were up 6.1% for single-family homes and 5.6% for condos and co-ops.
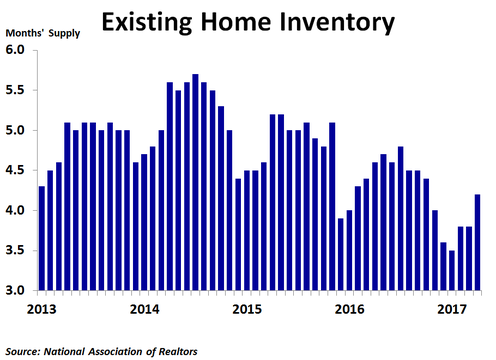
Inventory continues to be a big story right now. In April, inventories jumped 7.2%, typical for this time of year. This, combined with the slowdown in sales, pushed the supply up to 4.2 months. Even so, the 12-month moving average held steady at 4.2 months, down significantly from a couple years ago. One big reason that inventories are so low is that some people who bought homes at the peak of the bubble in 2006 still have not recuperated all of their losses. What homes do get listed are often scooped up quickly, and sellers are getting multiple offers that in some cases are above the asking price. This suggests a market top in prices may be near as buyers will likely not overbid for homes for too long. Indeed, the year-over-year rate of price growth is slowing in every region except for the Midwest.
Today’s report is in line with weakness seen in housing starts and new home sales for April. The good news is that mortgage rates have been trending down over the last couple months amid increased political uncertainty, which should boost housing as we head into the summer. The bad news is that the Fed seems ready to hike interest rates again. Stay tuned!
Today’s report is in line with weakness seen in housing starts and new home sales for April. The good news is that mortgage rates have been trending down over the last couple months amid increased political uncertainty, which should boost housing as we head into the summer. The bad news is that the Fed seems ready to hike interest rates again. Stay tuned!
 RSS Feed