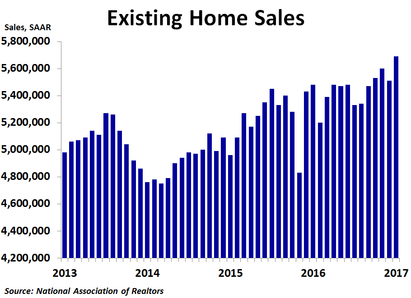
Existing home sales rose in January to 5.69 million units on a seasonally adjusted annualized basis, an improvement on December’s 5.51 million units, far better than the 5.58 million forecast and the highest since February 2007. Sales were up 3.3% from the prior month and 3.8% from a year ago, more than doubling December’s 1.5% year-ago pace.
By region, sales rose the most in the West, which saw a 6.6% increase from the prior month. Sales rose 5.3% in the Northeast and 3.6% in the South, but declined 1.5% in the Midwest. Compared to a year ago, sales were up a strong 8.4% in the West, 6.7% in the Northeast and 3.1% in the South, but were down 0.8% in the Midwest. Median prices were up the most in the South at 9.2% y/y, while they were up 6.8% in the West, 6.5% in the Midwest and just 2.5% in the Northeast.
By type, sales jumped 8.3% over December for condos and co-ops but rose just 2.6% for single family homes. On a year-ago basis, sales were up 4.8% for condos and co-ops and 3.7% for single family homes. Prices were up 7.3% from a year earlier for single family homes and up 6.2% for condos and co-ops. Inventory was down 10.0% y/y for single family homes and 13.2% y/y for condos and co-ops.
By type, sales jumped 8.3% over December for condos and co-ops but rose just 2.6% for single family homes. On a year-ago basis, sales were up 4.8% for condos and co-ops and 3.7% for single family homes. Prices were up 7.3% from a year earlier for single family homes and up 6.2% for condos and co-ops. Inventory was down 10.0% y/y for single family homes and 13.2% y/y for condos and co-ops.
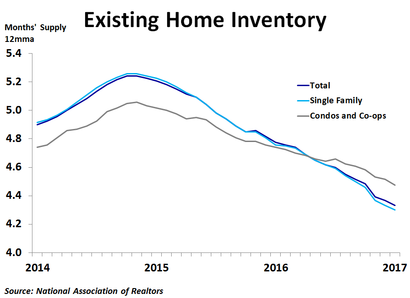
Inventory continues to be the big story right now. In January, there was only 3.6 months’ worth of supply available, the lowest in several years, while the 12-month moving average was just 4.3 months. With mortgage rates still fairly low on a historical basis, demand for existing homes is high, but with inventory so low, it is definitely a seller’s market, and a very tight one at that. One big reason that inventories are so low is that some people who bought homes at the peak of the bubble in 2006 still have not recuperated all of their losses, so they are reluctant to sell, choosing instead to wait for prices to go even higher. In addition, an improving economy has helped to open up job opportunities for many people, some of whom had to move. Thus, it could be that many people simply don’t want to or need to sell their home right now, even though prices have reached pre-crash peaks in some places. Recent college graduates, new job finders and those who have finally saved enough to buy a home are all competing for starter and mid-market homes, but are finding very slim pickings. Rising mortgage rates may be starting to temper demand as mortgage applications have dropped in 3 of the last 4 weeks, so if you are thinking about selling, do it.
 RSS Feed