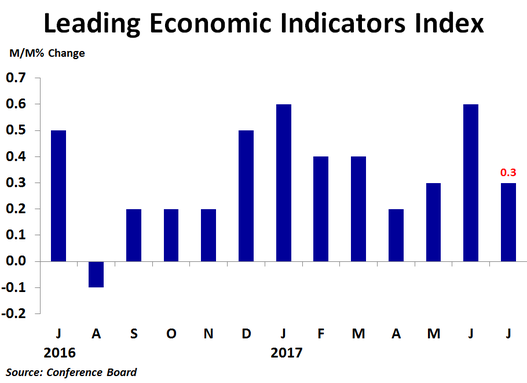
The leading economic indicators index rose 0.3% in July from the prior month following a 0.6% increase in June. The increase matched the consensus forecast. Compared to a year ago, the index was up 3.9%, slightly less than June’s 4.1% pace. Over the six month period ending in July, the index was up 2.3%, down slightly from the 2.6% rate of growth in the six months ending in June.
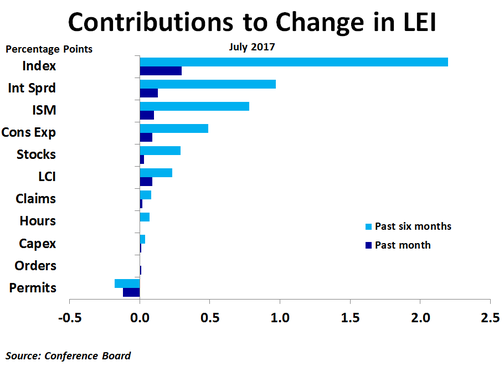
The interest rate spread between the 10-year Treasury yield and the Federal Funds rate led the way in July, contributing 0.13 percentage points to the growth in the index. Although this was the smallest contribution from this component since last August as the spread has narrowed, this component has still contributed the most to the rise in the index over the past six months. The ISM new orders index came in second, contributing 0.10 percentage points as the index remained on the upper end of the recent range in July. Consumer expectations for business conditions contributed 0.09 percentage points, a nice rebound from the weak contribution in June, likely driven by strong job growth. The stock market contributed 0.03 percentage points as the market continued its upward march despite political chaos. Another decline in average weekly jobless claims added 0.02 percentage points. Core capital goods orders and new orders for consumer goods contributed little to the index, while average weekly hours contributed nothing as hours were unchanged.
The only negative contribution came from building permits, which took 0.12 percentage points away from growth in the index as permits fell from 1.275 million units at a seasonally adjusted annualized rate in June to 1.223 million units in July.
The only negative contribution came from building permits, which took 0.12 percentage points away from growth in the index as permits fell from 1.275 million units at a seasonally adjusted annualized rate in June to 1.223 million units in July.
Although the interest rate spread is often among the largest contributors, its contribution has been trending slightly lower over the last few months as the Federal Reserve has been gradually raising the Federal Funds rate while the 10-year Treasury yield has come down as investors’ initial optimism about the new administration’s economic policies has been followed by some doubt about the chances for successful implementation.
The 10-year Treasury yield has fallen further in August amid rapidly mounting political tensions both here and abroad. It is becoming increasingly clear that Trump is going to have a very difficult time getting his much sought-after pro-business agenda implemented, which bodes ill for stocks and the economy.
The 10-year Treasury yield has fallen further in August amid rapidly mounting political tensions both here and abroad. It is becoming increasingly clear that Trump is going to have a very difficult time getting his much sought-after pro-business agenda implemented, which bodes ill for stocks and the economy.
 RSS Feed