New home sales fell in July to 571K units on a seasonally adjusted annualized basis, down from 630K units in June, which was revised up from 610K units, less than the consensus forecast of 610K units and the lowest since December 2016. Sales were down 9.4% from June and 8.2% from a year ago.
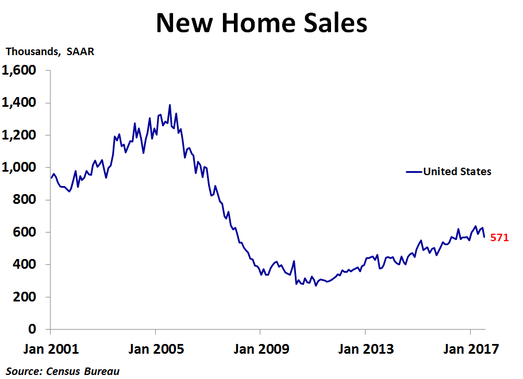
The only region where sales rose was in the Midwest, where sales increased 6.2% from the prior month. Sales fell 4.1% in the South, 21.3% in the West and 23.8% in the Northeast. Compared to a year ago, sales were only higher in the West, up a scant 1.4%, while sales were down 10.4% in the South, 12.7% in the Midwest and 13.5% in the Northeast.
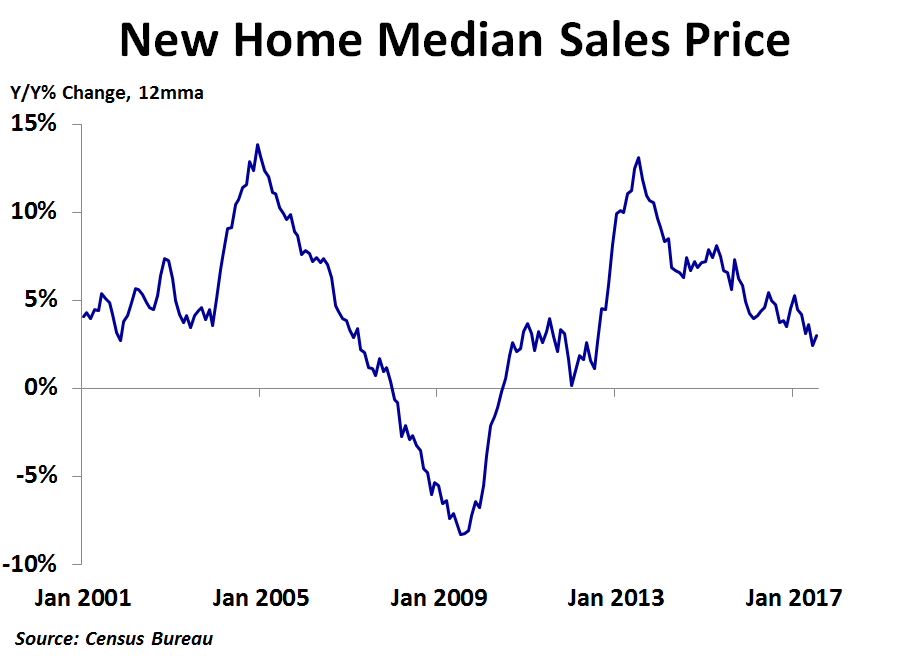
In the second quarter, the national median price was up 1.8% from the prior year. Prices were up 7.6% in the Midwest and 2.4% in the West, but were down 1.6% in the South and 6.6% in the Northeast. The Census Bureau does not report regional median prices by month, only quarterly and annually. In July, the national median price rose to $313,700, a 0.7% increase from the prior month, following a 3.5% drop in June. Compared to a year ago, the median price was up 6.3%. This was the sixth straight month where the direction of price changes on a year-ago basis was opposite that of the prior month. The 12-month moving average trend of price growth has been slowing over the last couple of years, and in June reached a new cyclical low of 2.4% but bounced back slightly to 3.0% in July. This suggests new home prices may be getting very close to a cyclical peak.
In the second quarter, the national median price was up 1.8% from the prior year. Prices were up 7.6% in the Midwest and 2.4% in the West, but were down 1.6% in the South and 6.6% in the Northeast. The Census Bureau does not report regional median prices by month, only quarterly and annually. In July, the national median price rose to $313,700, a 0.7% increase from the prior month, following a 3.5% drop in June. Compared to a year ago, the median price was up 6.3%. This was the sixth straight month where the direction of price changes on a year-ago basis was opposite that of the prior month. The 12-month moving average trend of price growth has been slowing over the last couple of years, and in June reached a new cyclical low of 2.4% but bounced back slightly to 3.0% in July. This suggests new home prices may be getting very close to a cyclical peak.
As with the existing home market, inventory continues to be a big story right now. In July, there was 5.8 months’ worth of supply available, a notable increase from June’s 5.2 months and the most since September 2015. An increase in inventory for sale to the highest since June 2009 and a decline in sales both led to the increase in months’ supply. Since 5-6 months’ supply is generally considered a balanced market, the market appears to be in fairly good balance right now. This has helped to keep prices fairly stable recently. The weakness in sales came despite a second straight month of sub-4% mortgage rates amid political uncertainty and slowing inflation.
With inflation slowing and still below the Fed’s target of 2.0%, the Fed held rates steady at July’s FOMC meeting. However, the bigger issue is when the Fed will start to reduce its balance sheet, which may begin in September. This might push up mortgage rates, but inflation and politics will also be factors.
With inflation slowing and still below the Fed’s target of 2.0%, the Fed held rates steady at July’s FOMC meeting. However, the bigger issue is when the Fed will start to reduce its balance sheet, which may begin in September. This might push up mortgage rates, but inflation and politics will also be factors.
 RSS Feed