New home sales rose in May to 610K units on a seasonally adjusted annualized basis, up from 593K units in April, which was revised up from 569K units, and well above the consensus forecast of 590K units. Sales were up 2.9% from April and 7.8% from a year ago.
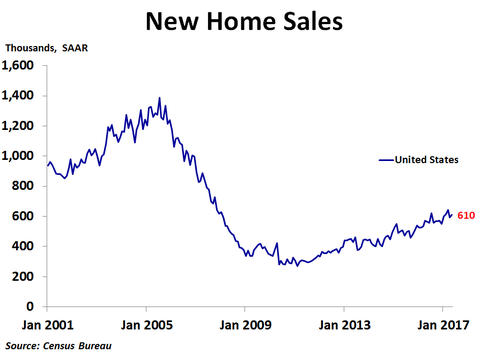
Sales rose 13.3% from the prior month in the West and 6.2% in the South. However, sales fell 10.8% in the Northwest and plunged 25.7% in the Midwest, the second straight large monthly decline, taking sales to the lowest level in that region since February 2015. Compared to a year ago, sales were up 14.1% in the West, 12.9% in the South and 3.1% in the Northeast. In the Midwest, sales were down 24.7%.
In the first quarter, the national median price was down 2.2% from the prior year, the first decline since the fourth quarter of 2011. Prices were up a sharp 32.6% in the Northeast and a scant 1.2% in the West, but were down 3.7% in the Midwest and 6.0% in the South. The Census Bureau does not report regional median prices by month, only quarterly and annually. In May, the national median price soared to a record $345,800, an 11.5% jump from the prior month, the largest monthly increase since October 2014. Compared to a year ago, the median price was up 16.8%, the most since September 2015. The 12-month moving average trend of price growth has been slowing over the last couple of years, and despite this measure rising from 3.1% in April to 4.2% in May, the downward trend remains in place, suggesting new home prices may be getting close to a cyclical peak. That being said, the big increase in the median price in May had a lot to do with a change in the mix of homes sold, as there was a big decline in sales in the $200K-$299K price range, while higher priced homes saw an increase in sales.
In the first quarter, the national median price was down 2.2% from the prior year, the first decline since the fourth quarter of 2011. Prices were up a sharp 32.6% in the Northeast and a scant 1.2% in the West, but were down 3.7% in the Midwest and 6.0% in the South. The Census Bureau does not report regional median prices by month, only quarterly and annually. In May, the national median price soared to a record $345,800, an 11.5% jump from the prior month, the largest monthly increase since October 2014. Compared to a year ago, the median price was up 16.8%, the most since September 2015. The 12-month moving average trend of price growth has been slowing over the last couple of years, and despite this measure rising from 3.1% in April to 4.2% in May, the downward trend remains in place, suggesting new home prices may be getting close to a cyclical peak. That being said, the big increase in the median price in May had a lot to do with a change in the mix of homes sold, as there was a big decline in sales in the $200K-$299K price range, while higher priced homes saw an increase in sales.
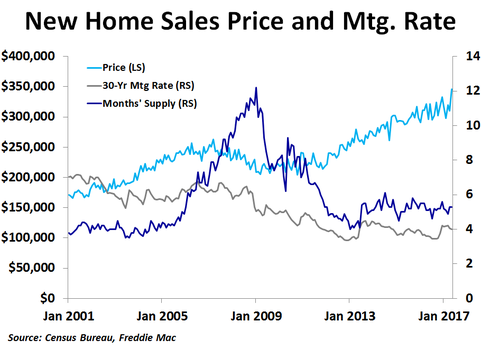
As with the existing home market, inventory continues to be a big story right now. In May, there was only 5.3 months’ worth of supply available. Although that is up from 4.9 months in March, it is still far below the supply levels of the previous boom. Fortunately, the number of new homes for sale has jumped in the last few months and is at the highest level since July 2009, which has helped to keep prices fairly stable recently. In addition, mortgage rates have been trending down over the last few weeks amid political uncertainty and slowing inflation. With supply and mortgage rates remaining very low, new home prices will likely remain elevated. Buyers would rejoice if high prices lured more supply to the market.
 RSS Feed