New home sales plunged in April to 569K units on a seasonally adjusted annualized basis, way down from 642K units in March, which was revised up from 621K units, and far below the consensus forecast of 602K units. March sales were the highest since October 2007. Sales were down 11.4% from the prior month and 0.2% from a year ago, the first decline on a year-ago basis since February 2016.
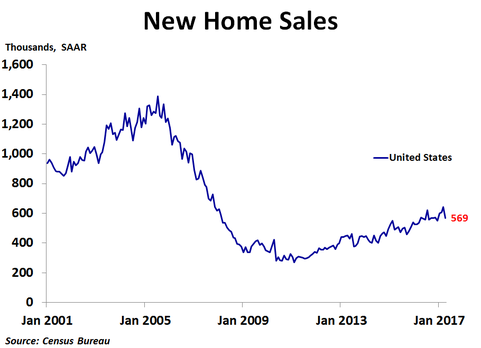
Sales fell in all four regions, with the biggest decline coming in the West, where sales plunged 26.3%. The Midwest saw a 13.1% drop, while sales fell 7.5% in the Northeast and 4.0% in the South. Compared to a year ago, sales were up 19.7% in the Midwest and 2.8% in the South, while sales were down 7.5% in the Northeast and 13.1% in the West.
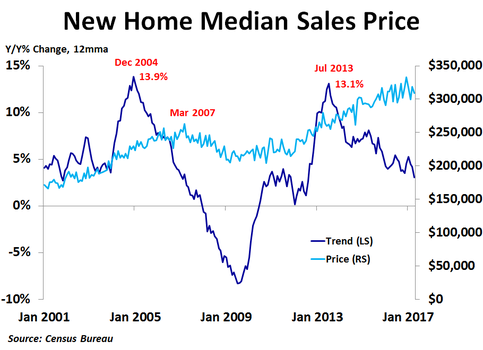
In the first quarter, the national median price was down 2.2% from the prior year, the first decline since the fourth quarter of 2011. Prices were up a sharp 32.6% in the Northeast and a scant 1.2% in the West, but were down 3.7% in the Midwest and 6.0% in the South. The Census Bureau does not report regional median prices by month, only quarterly and annually. In April, the national median price fell 3.0% from the prior month. Compared to a year ago, the median price was down 3.8%, nearly matching the 3.9% drop in February, which was the biggest decline since January 2012. The 12-month moving average trend of price growth has been slowing over the last couple of years and is currently the slowest in nearly five years, suggesting new home prices may be near a cyclical peak.
In the first quarter, the national median price was down 2.2% from the prior year, the first decline since the fourth quarter of 2011. Prices were up a sharp 32.6% in the Northeast and a scant 1.2% in the West, but were down 3.7% in the Midwest and 6.0% in the South. The Census Bureau does not report regional median prices by month, only quarterly and annually. In April, the national median price fell 3.0% from the prior month. Compared to a year ago, the median price was down 3.8%, nearly matching the 3.9% drop in February, which was the biggest decline since January 2012. The 12-month moving average trend of price growth has been slowing over the last couple of years and is currently the slowest in nearly five years, suggesting new home prices may be near a cyclical peak.
As with the existing home market, inventory continues to be a big story right now. In April, there was only 5.7 months’ worth of supply available. Although that is up from 4.9 months in March, it is still far below the supply levels of the previous boom. Fortunately, the number of new homes for sale has jumped in the last few months and is at the highest level since July 2009, which has helped to keep prices fairly stable recently. Mortgage rates have been trending down over the last few weeks as investors have become more uncertain about the success or impacts of pro-growth policies under the Trump administration. In addition, inflation slowed in April, suggesting interest rates will likely stay fairly low in the near term.
The trend of home price growth took another step closer to zero in April as it continues to mirror the previous cycle. Falling prices may soon become the new trend, especially if the Fed raises interest rates.
The trend of home price growth took another step closer to zero in April as it continues to mirror the previous cycle. Falling prices may soon become the new trend, especially if the Fed raises interest rates.
 RSS Feed