New home sales rose in June to 610K units on a seasonally adjusted annualized basis, up from 605K units in May, which was revised down from 610K units, and in line with the consensus forecast of 611K units. Sales were up 0.8% from May and 9.3% from a year ago.
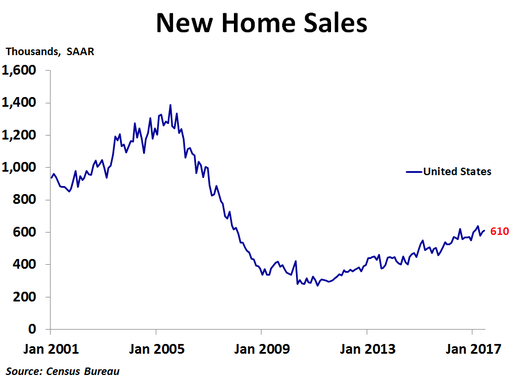
Sales rose 12.5% from the prior month in the West and 10.0% in the Midwest. However, sales were flat in the Northeast and fell 6.1% in the South. Compared to a year ago, sales were up 46.4% in the Northeast, 34.3% in the West and 0.6% in the South, but were down a steep 12.0% in the Midwest.
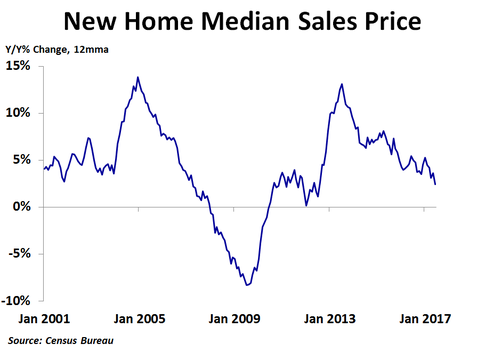
In the second quarter, the national median price was up 1.8% from the prior year. Prices were up 7.6% in the Midwest and 2.4% in the West, but were down 1.6% in the South and 6.6% in the Northeast. The Census Bureau does not report regional median prices by month, only quarterly and annually. In June, the national median price fell to $310,800, a 4.2% decline from the prior month, following a notable increase in May. Compared to a year ago, the median price was down 3.4%, the third year-ago decline in the past five months. The 12-month moving average trend of price growth has been slowing over the last couple of years, and in June reached a new cyclical low of 2.4%. This suggests new home prices may be getting close to a cyclical peak. The decline in the median price in June had a lot to do with a change in the mix of homes sold, as sales in the $200K-$299K price range rose while sales in the $300K-$399K price range declined.
In the second quarter, the national median price was up 1.8% from the prior year. Prices were up 7.6% in the Midwest and 2.4% in the West, but were down 1.6% in the South and 6.6% in the Northeast. The Census Bureau does not report regional median prices by month, only quarterly and annually. In June, the national median price fell to $310,800, a 4.2% decline from the prior month, following a notable increase in May. Compared to a year ago, the median price was down 3.4%, the third year-ago decline in the past five months. The 12-month moving average trend of price growth has been slowing over the last couple of years, and in June reached a new cyclical low of 2.4%. This suggests new home prices may be getting close to a cyclical peak. The decline in the median price in June had a lot to do with a change in the mix of homes sold, as sales in the $200K-$299K price range rose while sales in the $300K-$399K price range declined.
As with the existing home market, inventory continues to be a big story right now. In June, there was only 5.4 months’ worth of supply available. Although that is up from 5.0 months in March, it is still far below the supply levels of the previous boom and on the low end of the 5-6 month range generally considered a balanced market. Fortunately, the number of new homes for sale has jumped in the last few months and is at the highest level since June 2009. This has helped to keep prices fairly stable recently. In addition, mortgage rates have been trending down over the last few weeks amid political uncertainty and slowing inflation.
With inflation slowing and still below the Fed’s target of 2.0%, the Fed held rates steady at today’s FOMC meeting. However, the bigger issue is when the Fed will start to reduce its balance sheet, which they said will begin relatively soon. This will likely push up mortgage rates, but inflation will also play a big part.
With inflation slowing and still below the Fed’s target of 2.0%, the Fed held rates steady at today’s FOMC meeting. However, the bigger issue is when the Fed will start to reduce its balance sheet, which they said will begin relatively soon. This will likely push up mortgage rates, but inflation will also play a big part.
 RSS Feed