Ed Kashmarek - The Everyday Economist
  • Home
  • About
    • Skills
    • Volunteering
    • Music
    • Microfinance
    • Photos
    • Book List
  • Work Samples
  • Reports
  • Blog
  • Charts
  • Podcast
  • Webinars
  • Tableau
    • Employment Analysis Tool (Web)
    • Employment Analysis Tool (Mobile)
    • GDP Analysis Tool (Web)
    • GDP Analysis Tool (Mobile)
    • MN Housing
  • Feedback
  • Join Email List
  • Booking

Industrial Production Surges and Capacity Utilization Rises in April

5/17/2017

0 Comments

 
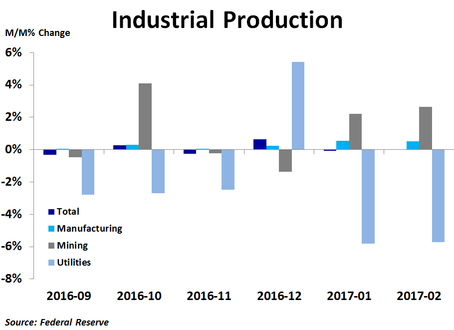
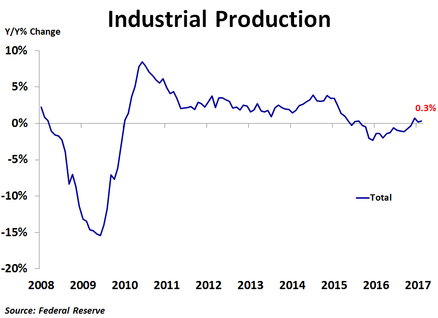
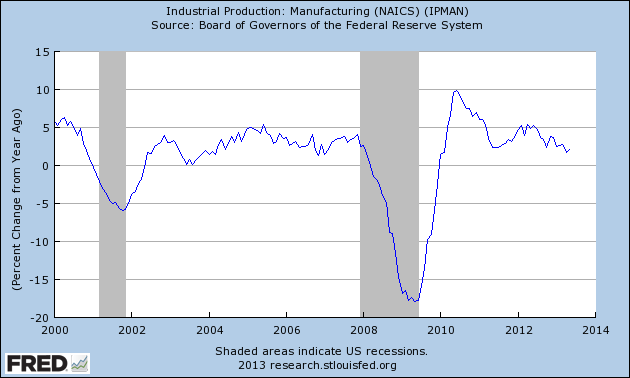
Industrial production jumped 1.0% in April, more than double the 0.4% consensus forecast and much better than March’s 0.4% increase, which was revised down from 0.5%. The increase was led by a 1.2% rise in mining, followed closely by a 1.0% rise in manufacturing and a 0.7% rise in utility output. It was a rare month when all three major categories saw increases in production. Overall production was up 2.2% on a year-ago basis, the strongest rate of growth since January 2015.
Picture
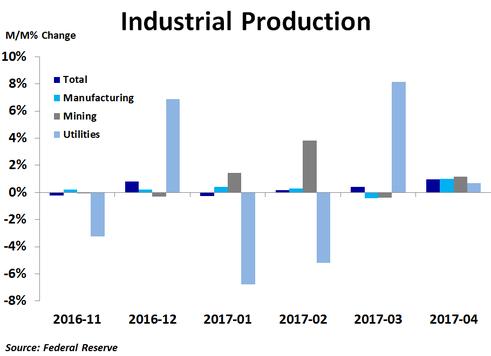
In manufacturing, production was led by a 5.0% spike in production of motor vehicles and parts, but this was after a big 3.6% decline in March. Petroleum and coal products production rose 2.5% and electric power generation, transmission and distribution rose 2.1%. On the downside, natural gas distribution plunged 9.5% following a 24.3% jump in March, production of non-metallic mineral products fell 1.0% and aerospace and  transportation equipment production fell 0.7%.           

Compared to a year ago, production was up 7.3% for mining and 7.0% for petroleum and coal products. Conversely, the worst performance was in natural gas distribution, which was down 10.7%, apparel and leather goods, production of which was down 4.7%, and aerospace and transportation equipment, production of which was down 3.1%.

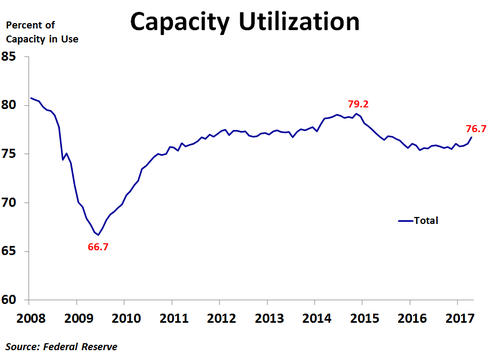
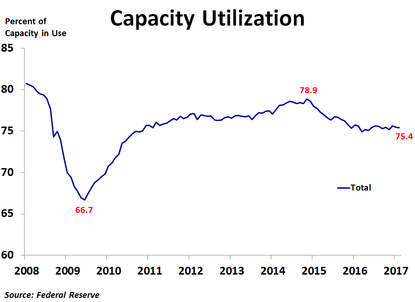
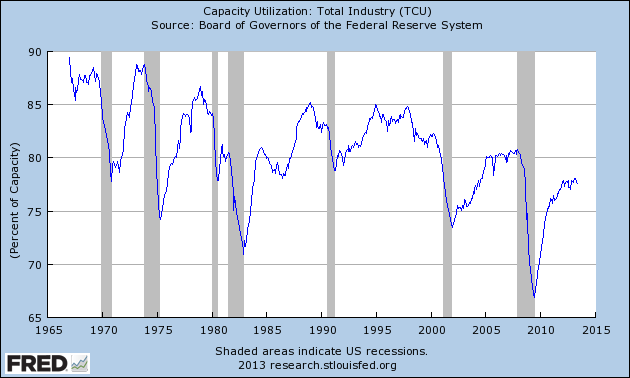
​Capacity utilization increased from 76.1% to 76.7%, but was still below the recent peak of 79.2% back in November 2014. This has helped to keep inflation largely subdued outside of energy for the last two years. The utilization rate has been fairly steady since reaching a recent low of 75.4% in March 2016, but April’s reading is a bit of a breakout from the recent trend. The most pressure is currently seen in oil and gas extraction, where 96.4% of capacity is in use. Nonmetallic mineral mining and quarrying and plastic materials and resin utilization is also high, at 91.1% and 89.4%, respectively. On the flip side, support activities for mining are only using 52.1% of capacity.  
Picture
​Survey data for manufacturing has been quite strong recently, but that strength had not shown up in actual production data until April. That being said, since April’s strength was largely due to the rebound in motor vehicle and parts production, we will have to see if that strength continues into May to determine if manufacturing activity is truly gaining momentum. Recent political turmoil is pushing interest rates down, which should help to support sales and production of motor vehicles.
0 Comments

Industrial Production Rises in March on Jump in Utilities Output

4/19/2017

0 Comments

 
​Industrial production rose 0.5% in March, slightly better than the 0.4% consensus forecast and much better than February’s 0.1% increase, which was revised up from no change. The increase was driven by an 8.6% jump in utility output after two months of big declines. This was offset by a 0.4% decline in manufacturing output. Mining output was little changed. Overall production was up 1.5% on a year-ago basis, the strongest in two years.
Picture
In manufacturing, production was led by a 1.5% increase in petroleum and coal products and a 0.9% increase in computer and electronic products. On the downside, production of motor vehicles and parts fell 3.0%, in line with plunging vehicle sales, while production of apparel and leather goods fell 1.6% and production of electrical equipment, appliances and components fell 1.6%.         

Compared to a year ago, production was up 26.5% for natural gas distribution, the most by far, as furnaces kicked into gear with a return to more seasonable temperatures. Machinery production was up 4.5%, while computer and electronic products production was up 3.9%. Conversely, the worst performance was in apparel and leather goods, production of which was down 6.4%, and aerospace and miscellaneous transportation equipment, which was down 2.5%.

​Capacity utilization increased from 75.7% to 76.1%, but was still below the recent peak of 78.9% back in November 2014. This has helped to keep inflation largely subdued outside of energy for the last two years. The utilization rate has been fairly steady since reaching a recent low of 75.4% in March 2016. The most pressure is currently seen in oil and gas extraction, where 95.7% of capacity is in use. Nonmetallic mineral mining and quarrying and plastic materials and resin utilization is also high, at 90.7% and 88.6%, respectively. On the flip side, support activities for mining are currently only using 48.1% of capacity.  
Picture
​Survey data for manufacturing has been quite strong recently, so the decline in manufacturing output in March is a bit of a surprise. It appears as though higher vehicle loan rates, which followed the rise in the 10-year yield due to increased optimism about the economy after the presidential election, have weighed on vehicle sales and production recently. This is a major reason why first quarter economic growth is expected to be quite weak. In turn, interest rates have been falling, which will hopefully revive the vehicle industry a bit.
0 Comments

Industrial Production Flat in February

3/17/2017

0 Comments

 
Industrial production was flat in February, weaker than the consensus forecast of 0.2% growth, as a 0.5% increase in manufacturing production and a 2.7% increase in mining production were offset by a 5.7% decline in utilities production as warm weather led to a reduction in natural gas and electricity usage. Overall production was up just 0.3% y/y.
Picture
Production in February was led by a strong 2.7% increase in mining amid a rebound in commodity prices and gradual improvements in the economy. This helped to expand mining employment during the month, which is good news since these jobs are well-paid.

In manufacturing, production was led by a 1.4% increase in paper and a 1.3% increase in plastics and rubber products. On the downside, electrical equipment, appliances and components fell 1.5%, furniture and related products fell 1.4% and textiles fell 1.4%.          
Utilities had a very poor month as natural gas distribution plunged 12.9%, while electric power generation, transmission and distribution fell 5.0%. As a result, the industry lost 1,000 jobs in February, the second straight month of job losses. Since these are also highly paid jobs, losing these jobs is bad news.

Compared to a year ago, production was up the most for machinery, having risen 5.1% since last February. Computer and electronic products were up 5.0%, while wood products were up 3.7%. Conversely, the worst performance was in natural gas distribution, which was down 10.6%, and electric power generation, transmission and distribution, which was down 6.7% from a year ago.
Picture
Capacity utilization slid from 75.5% to 75.4%, down from a recent peak of 78.9% back in November 2014. This has helped to keep inflation largely subdued outside of energy for the last two years. However, the utilization rate has stopped falling since reaching a recent low of 74.9% in March of last year, and has been fairly stable since then. The most pressure is currently seen in nonmetallic mineral mining and quarrying, where 95.8% of capacity is in use. Oil and gas extraction and plastic minerals utilization is also high, at 95.7% and 89.8%, respectively. On the flip side, support activities for mining are only using 39.1% of capacity.  

​Survey data for manufacturing has been quite strong recently, and that optimism is finally showing up in real activity. A few more months of real data will clarify whether manufacturing has truly turned the corner. More business-friendly policies should help.
Picture
0 Comments

Industrial Production Remained Flat in May

6/14/2013

0 Comments

 
Industrial production was unchanged in May, weighed down by a second straight monthly decline in utility output. A cooler than normal May could have been a culprit in the drop in utility output, which fell 1.8% following a 3.2% decline in April. Mining also saw a pullback to 0.7% from 1.1%. Meanwhile, manufacturing output remained soft, scratching out a 0.1% gain following two months of declines.

Production of consumer goods was soft again, falling 0.1% on the month after dropping 0.7% in April, as production of foods, tobacco products, paper and consumer energy products fell. Business equipment production increased 0.2% following a 0.3% decline in April, led by increases in electrical instruments and medium and heavy duty trucks.

It is clear that industrial production is weakening, as production was only 1.6% higher than a year ago in May, the lowest rate of growth since February 2010 (chart 1). Although utility production has been very weak lately, the much larger manufacturing component also remains subdued (chart 2). In addition, capacity utilization, while much improved since the depths of the recession, appears to be leveling off at levels not much higher than the troughs of past business cycles (chart 3). This report, along with the softness in core producer inflation, will allow the Fed to continue its accommodative monetary stance with little concern about inflation for the time being.
Picture
Picture
Picture
0 Comments

    Archives

    September 2017
    August 2017
    July 2017
    June 2017
    May 2017
    April 2017
    March 2017
    February 2017
    June 2013
    May 2013

    Categories

    All
    Construction Spending
    CPI
    Employment Report
    Existing Home Sales
    GDP
    Housing Market Index
    Import Prices
    Industrial Production
    Leading Economic Indicators
    New Home Sales
    Personal Income And Outlays
    Producer Prices
    Retail Sales
    Small Business Optimism
    Trade

    RSS Feed

Proudly powered by Weebly