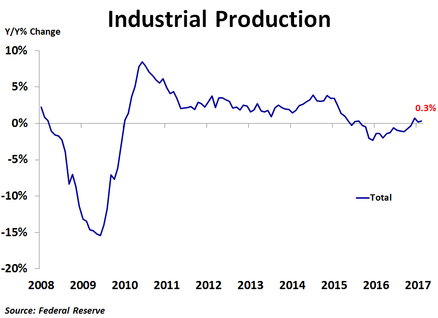
Industrial production was flat in February, weaker than the consensus forecast of 0.2% growth, as a 0.5% increase in manufacturing production and a 2.7% increase in mining production were offset by a 5.7% decline in utilities production as warm weather led to a reduction in natural gas and electricity usage. Overall production was up just 0.3% y/y.
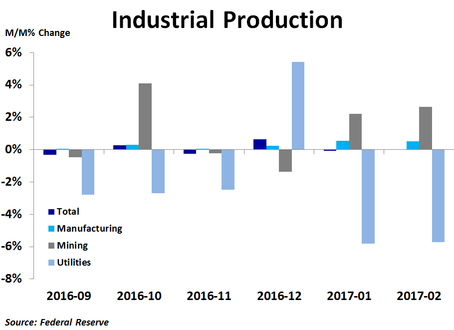
Production in February was led by a strong 2.7% increase in mining amid a rebound in commodity prices and gradual improvements in the economy. This helped to expand mining employment during the month, which is good news since these jobs are well-paid.
In manufacturing, production was led by a 1.4% increase in paper and a 1.3% increase in plastics and rubber products. On the downside, electrical equipment, appliances and components fell 1.5%, furniture and related products fell 1.4% and textiles fell 1.4%.
Utilities had a very poor month as natural gas distribution plunged 12.9%, while electric power generation, transmission and distribution fell 5.0%. As a result, the industry lost 1,000 jobs in February, the second straight month of job losses. Since these are also highly paid jobs, losing these jobs is bad news.
Compared to a year ago, production was up the most for machinery, having risen 5.1% since last February. Computer and electronic products were up 5.0%, while wood products were up 3.7%. Conversely, the worst performance was in natural gas distribution, which was down 10.6%, and electric power generation, transmission and distribution, which was down 6.7% from a year ago.
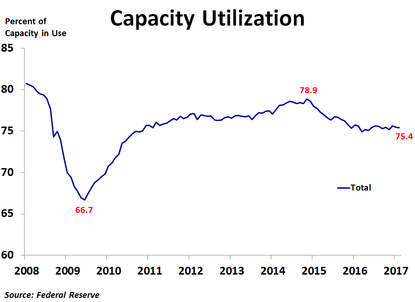
Capacity utilization slid from 75.5% to 75.4%, down from a recent peak of 78.9% back in November 2014. This has helped to keep inflation largely subdued outside of energy for the last two years. However, the utilization rate has stopped falling since reaching a recent low of 74.9% in March of last year, and has been fairly stable since then. The most pressure is currently seen in nonmetallic mineral mining and quarrying, where 95.8% of capacity is in use. Oil and gas extraction and plastic minerals utilization is also high, at 95.7% and 89.8%, respectively. On the flip side, support activities for mining are only using 39.1% of capacity.
Survey data for manufacturing has been quite strong recently, and that optimism is finally showing up in real activity. A few more months of real data will clarify whether manufacturing has truly turned the corner. More business-friendly policies should help.
Survey data for manufacturing has been quite strong recently, and that optimism is finally showing up in real activity. A few more months of real data will clarify whether manufacturing has truly turned the corner. More business-friendly policies should help.
 RSS Feed