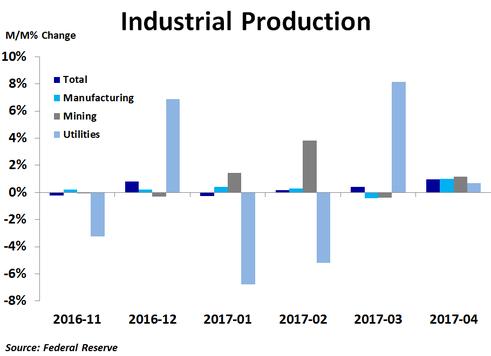
Industrial production jumped 1.0% in April, more than double the 0.4% consensus forecast and much better than March’s 0.4% increase, which was revised down from 0.5%. The increase was led by a 1.2% rise in mining, followed closely by a 1.0% rise in manufacturing and a 0.7% rise in utility output. It was a rare month when all three major categories saw increases in production. Overall production was up 2.2% on a year-ago basis, the strongest rate of growth since January 2015.
In manufacturing, production was led by a 5.0% spike in production of motor vehicles and parts, but this was after a big 3.6% decline in March. Petroleum and coal products production rose 2.5% and electric power generation, transmission and distribution rose 2.1%. On the downside, natural gas distribution plunged 9.5% following a 24.3% jump in March, production of non-metallic mineral products fell 1.0% and aerospace and transportation equipment production fell 0.7%.
Compared to a year ago, production was up 7.3% for mining and 7.0% for petroleum and coal products. Conversely, the worst performance was in natural gas distribution, which was down 10.7%, apparel and leather goods, production of which was down 4.7%, and aerospace and transportation equipment, production of which was down 3.1%.
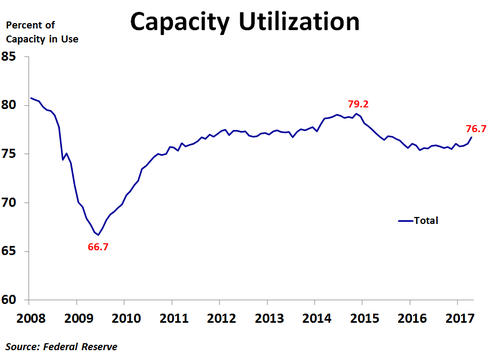
Capacity utilization increased from 76.1% to 76.7%, but was still below the recent peak of 79.2% back in November 2014. This has helped to keep inflation largely subdued outside of energy for the last two years. The utilization rate has been fairly steady since reaching a recent low of 75.4% in March 2016, but April’s reading is a bit of a breakout from the recent trend. The most pressure is currently seen in oil and gas extraction, where 96.4% of capacity is in use. Nonmetallic mineral mining and quarrying and plastic materials and resin utilization is also high, at 91.1% and 89.4%, respectively. On the flip side, support activities for mining are only using 52.1% of capacity.
Survey data for manufacturing has been quite strong recently, but that strength had not shown up in actual production data until April. That being said, since April’s strength was largely due to the rebound in motor vehicle and parts production, we will have to see if that strength continues into May to determine if manufacturing activity is truly gaining momentum. Recent political turmoil is pushing interest rates down, which should help to support sales and production of motor vehicles.


 RSS Feed