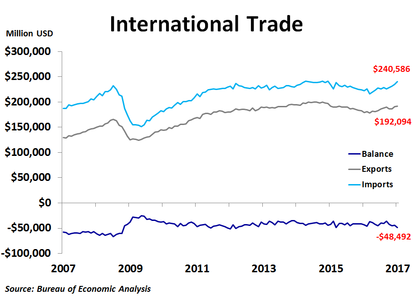
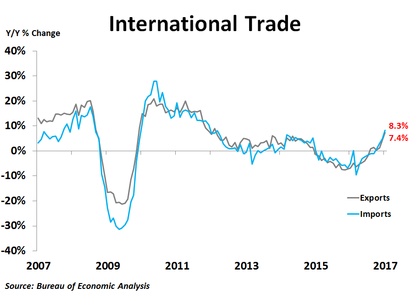
The U.S. trade deficit widened substantially in January to $48.5 billion from $44.3 billion as exports rose by $1.1 billion, while imports surged by $5.3 billion. Compared to a year ago, exports were up 7.4% and imports were up 8.3%, both of which were the strongest rates of growth in the last five years.
The increase in exports was led by a $2.1 billion rise in industrial supplies and materials, the bulk of which came from petroleum products and crude oil. Automotive vehicles, parts and engines also saw strong growth of $1.3 billion, mostly from cars. Exports of foods, feeds and beverages rose by $594 million, driven largely by soybeans. Exports of capital goods plunged by $1.9 billion thanks to big declines in exports of civilian aircraft and engines. Consumer goods exports were virtually flat as strong pharmaceutical exports were offset by a drop in exports of gems and jewelry.
The surge in imports was driven by a $2.4 billion jump in consumer goods, nearly half of which came from cell phones and other household goods. Industrial supplies and materials imports rose by $1.0 billion, led by crude oil and petroleum products. Imports of automotive vehicles, parts and engines rose by $899 million, while semi-conductors and aircraft parts drove a $668 million increase in capital goods imports. Imports of foods, feeds and beverages fell a by scant $57 million.
The biggest contributions to the change in the deficit in January came from capital goods and consumer goods. Consumer goods accounted for half of the trade deficit in goods in January, while automotive vehicles and parts accounted for a quarter of the deficit.
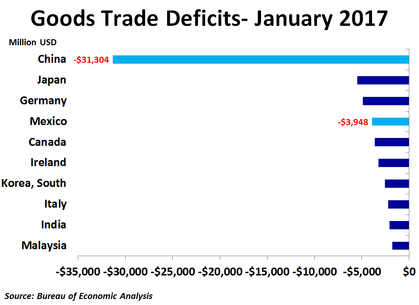
Regionally, the big story in today’s report is a $1.6 billion decline in exports to China. Combined with a $1.9 billion increase in imports from China, trade with China accounted for a third of the non-seasonally adjusted $10.3 billion increase in the goods deficit in January. Trade with Canada, South Korea and Saudi Arabia also contributed to the widening of the deficit. Trade with China accounted for nearly half of the level of the deficit in January.
Although the trade deficit widened in January, it was due to very strong imports, suggesting robust demand from U.S. consumers and businesses. The swift appreciation of the dollar over the last few months has also contributed to the widening imbalance. However, with the dollar taking a breather since the beginning of the year, we may see a slight narrowing of the deficit in the coming months.
Although the trade deficit widened in January, it was due to very strong imports, suggesting robust demand from U.S. consumers and businesses. The swift appreciation of the dollar over the last few months has also contributed to the widening imbalance. However, with the dollar taking a breather since the beginning of the year, we may see a slight narrowing of the deficit in the coming months.
 RSS Feed