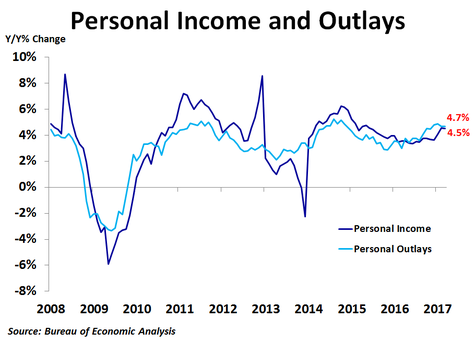
Personal income rose 0.2% in March from the prior month, less than the consensus forecast of 0.3%, and was up 4.5% from a year ago. Personal spending was flat for the second straight month, missing the 0.1% forecast, but was up 4.7% from a year ago, matching February’s pace but down slightly from January’s 4.9% pace, which was the strongest growth since November 2014. As income grew faster than spending, the personal savings rate inched up to 5.9% from 5.7%.
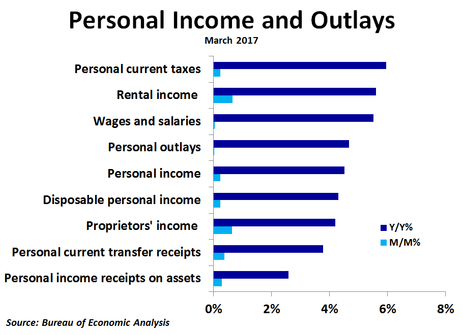
Compared to a month ago, rental income led the way with a 0.7% increase. Proprietors’ income followed with a 0.6% increase. Personal current transfer receipts rose 0.4% as social security payments rose 0.8% while unemployment insurance dropped 1.4%. Personal income receipts on assets rose 0.3%, almost all of which came from interest income. The all-important wages and salaries component increased by just 0.1% as government wages and salaries rose by 0.2% while private wages and salaries were flat.
Compared to a year ago, rental income also topped the charts, rising by a very strong 5.6%, as high home prices are pushing up rents. Wages and salaries were up 5.5%, with private industry wage growth of 5.9% far outpacing government wage growth of just 3.5%. Proprietors’ income was up 4.2% as non-farm income was up 5.4% while farm income was down 47%. Personal current transfer receipts were up 3.8%, with the strongest growth coming from veterans’ benefits at 5.2%, while unemployment insurance was down 9.0%. Income on assets was up just 2.6%, driven almost entirely by interest income.
Compared to a year ago, rental income also topped the charts, rising by a very strong 5.6%, as high home prices are pushing up rents. Wages and salaries were up 5.5%, with private industry wage growth of 5.9% far outpacing government wage growth of just 3.5%. Proprietors’ income was up 4.2% as non-farm income was up 5.4% while farm income was down 47%. Personal current transfer receipts were up 3.8%, with the strongest growth coming from veterans’ benefits at 5.2%, while unemployment insurance was down 9.0%. Income on assets was up just 2.6%, driven almost entirely by interest income.
Wages and salaries accounted for over half of the total increase in personal income on a year-ago basis, most of which came from private industry wages. However, wages and salaries accounted for only a tenth of the increase on a month-ago basis, most of which came from government wages. Personal current transfer receipts saw the second highest contribution to yearly growth but the highest contribution to monthly growth, most of which came from social security payments.
A big 6.0% increase in tax payments from the prior year knocked the growth rate of personal disposable income down to 4.3% from 4.4%. However, real personal disposable income growth increased to 2.4% from 2.2% thanks to a decline in prices in March. This should help to support second quarter economic growth after a dismal first quarter.
A big 6.0% increase in tax payments from the prior year knocked the growth rate of personal disposable income down to 4.3% from 4.4%. However, real personal disposable income growth increased to 2.4% from 2.2% thanks to a decline in prices in March. This should help to support second quarter economic growth after a dismal first quarter.
 RSS Feed