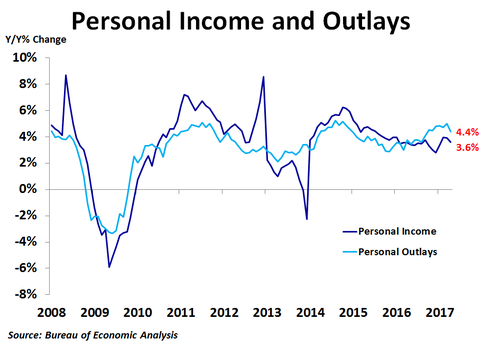
Personal income rose 0.4% in April from the prior month, matching the consensus forecast, and was up 3.6% from a year ago. Personal spending also rose 0.4%, matching the consensus forecast, and was up 4.4% from a year ago, the slowest rate of growth since September. As income and spending grew at the same rate, the personal savings rate held at 5.3% for the third consecutive month.
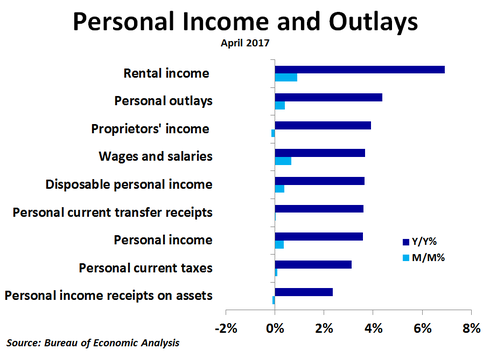
Compared to a month ago, rental income led the way again with a 0.9% increase. Wages and salaries followed with a 0.7% increase, driven by a 0.8% rebound in private industry wages after no change in March. Personal current transfer receipts were flat as social security payments rose just 0.1% while veterans’ benefits dipped and unemployment insurance plunged. Personal income receipts on assets fell 0.1% as an increase in dividend income was offset by a decline in interest income as interest rates fell during the month. Proprietors’ income declined 0.2% as both farm and non-farm income dropped on the month.
Compared to a year ago, rental income also topped the charts, rising by a very strong 6.9%, as high home prices are pushing up rents. Proprietors’ income was up 3.9% as non-farm income was up 5.0% while farm income was still down 44.1%. Wages and salaries were up 3.7%, with private industry wage growth slipping to 3.7% to almost match government wage growth of 3.5%. Personal current transfer receipts were up 3.6%, with the strongest growth coming from Medicaid at 5.1%, while unemployment insurance was down 9.6%. Income on assets was up just 2.4%, driven primarily by interest income.
Compared to a year ago, rental income also topped the charts, rising by a very strong 6.9%, as high home prices are pushing up rents. Proprietors’ income was up 3.9% as non-farm income was up 5.0% while farm income was still down 44.1%. Wages and salaries were up 3.7%, with private industry wage growth slipping to 3.7% to almost match government wage growth of 3.5%. Personal current transfer receipts were up 3.6%, with the strongest growth coming from Medicaid at 5.1%, while unemployment insurance was down 9.6%. Income on assets was up just 2.4%, driven primarily by interest income.
Wages and salaries accounted for just over half of the total increase in personal income on a year-ago basis, most of which came from private industry wages. However, wages and salaries accounted for nearly all of the increase on a month-ago basis, with the vast majority coming from private industry wages. Personal current transfer receipts saw the second highest contribution to yearly growth but only contributed 2% of monthly growth, most of which came from Medicare.
The growth rate of personal tax payments slowed to 3.1% from a year ago, leaving disposable income up 3.7%. After factoring in inflation, real personal disposable income growth dipped from 2.0% to 1.9%, and real spending slowed from 3.1% to 2.7%. With inflation and real income and spending slowing, a Fed rate hike in June is looking less likely.
The growth rate of personal tax payments slowed to 3.1% from a year ago, leaving disposable income up 3.7%. After factoring in inflation, real personal disposable income growth dipped from 2.0% to 1.9%, and real spending slowed from 3.1% to 2.7%. With inflation and real income and spending slowing, a Fed rate hike in June is looking less likely.


 RSS Feed