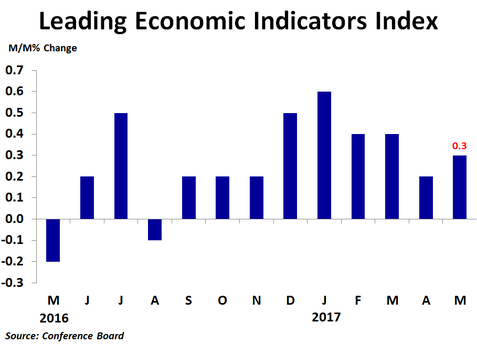
The leading economic indicators index rose 0.3% in May from the prior month following a downwardly revised 0.2% increase in April. The increase matched the consensus forecast. Compared to a year ago, the index was up 2.7%, more than April’s 2.2% pace. Over the six month period ending in April, the index was up 2.3%, up slightly from the 2.2% rate of growth in the six months to April.
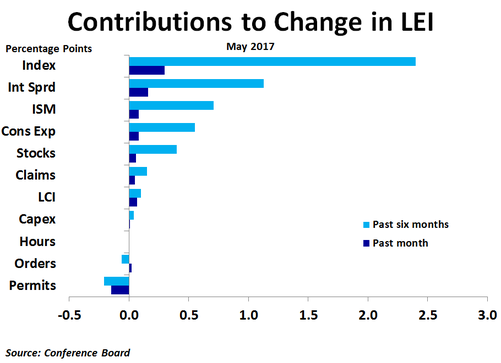
The interest rate spread between the 10-year Treasury yield and the Federal Funds rate led the way in May, contributing 0.16 percentage points to the growth in the index. Although this ties April’s reading for the smallest contribution from this component since October as the spread has narrowed, this component has still contributed the most to the rise in the index over the past six months. The ISM new orders index contributed 0.08 percentage points as the index itself rose 2 points to 59.5 from 57.5 in April. Consumer expectations of business conditions also added 0.08 percentage points as consumers remain hopeful that economic policy changes will boost business and the economy. The stock market contributed 0.06 percentage points as the market continues to rise despite political uncertainty and signs of a slowing housing market. Jobless claims contributed 0.05 percentage points in May as average weekly claims fell to 239,700 from 243,000 in a sign of continued labor market strength. Core capital goods orders and average weekly hours contributed virtually nothing in May.
The biggest negative contribution once again came from building permits, the third time in the last four months this has been the case. Permits took 0.15 percentage points away from growth in the index as permits fell to 1.168 million units on an annualized basis in May from 1.228 million units in April.
The biggest negative contribution once again came from building permits, the third time in the last four months this has been the case. Permits took 0.15 percentage points away from growth in the index as permits fell to 1.168 million units on an annualized basis in May from 1.228 million units in April.
Although the interest rate spread is often among the largest contributors, its contribution has been trending slightly lower over the last few months as investors have been turning back to bonds as initial optimism about the new administration’s economic policies has been followed by some doubt about the chances for successful implementation and the possible impacts on the economy and earnings, especially surrounding the healthcare overhaul.
Given slowing inflation, weak wage and job growth and signs of a possible top in housing, the Fed’s June rate hike appears a bit misplaced. Talk of trimming its balance sheet also seems to be coming at the wrong time.
Given slowing inflation, weak wage and job growth and signs of a possible top in housing, the Fed’s June rate hike appears a bit misplaced. Talk of trimming its balance sheet also seems to be coming at the wrong time.


 RSS Feed