According to the Commerce Department, total construction spending plunged by $17.0 billion, or 1.4%, in April to $1.218 trillion, but remained above the peak reached before the recession. Compared to a year ago, spending was up 6.7%, a noticeable improvement from March’s 5.0% rate of growth, but this was only because the previous April was very weak, making the year-over-year comparison much more favorable.
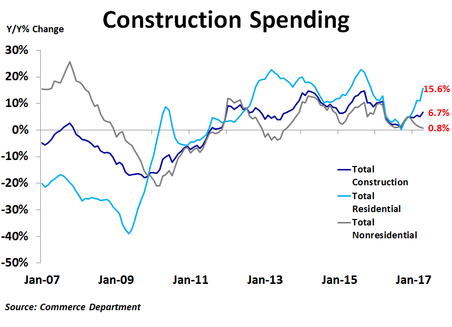
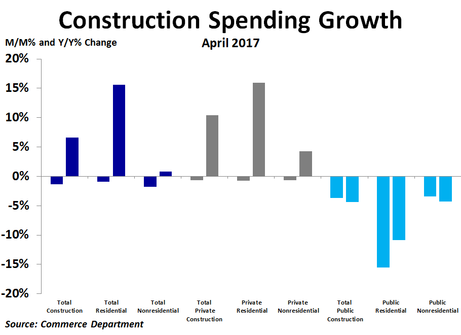
Unlike in months past, in April both residential and non-residential spending fell. While residential spending dropped by $4.7 billion, or 0.9%, from the prior month, non-residential spending plunged by $12.3 billion, or 1.7%. These measures were up 15.6% and 0.8% compared to a year ago, respectively.
There was only one kernel of strength in non-residential spending, which came from a $263 million, or 2.4%, increase in spending on water supply projects. The only other positive was a meager $8.0 million increase in office buildings. Weakness was widespread, led by a $3.5 billion decline in highways and streets, a $2.1 billion drop in power projects and a $1.5 billion decline in educational facilities.
Also unlike past months, both private and public spending declined. Private spending fell by $6.4 billion, split nearly evenly between residential and non-residential spending,. Public construction plunged by $10.6 billion, driven almost entirely by non-residential spending. Weakness in private non-residential spending was led by a $1.3 billion decline in manufacturing and a $1.3 billion drop in power projects. The only real strength was a $1.1 billion increase in office buildings. On the public side, the weakness was led by a $3.4 billion plunge in highways and streets. Public non-residential spending accounted for over half of the drop in total construction spending.
Compared to a year ago, the strongest growth in total construction spending has come from residential, office and commercial projects. Conversely, the biggest declines have been seen in sewage and waste disposal, religious facilities and conservation projects.
The residential sector of the U.S. economy has been a pillar of strength over the last several years. This has helped to soften the blow from weaker government spending during the same period. Despite falling interest rates, housing activity was quite weak in April. This is a concern for the economy, and along with slowing inflation, just may lead the Fed to hold rates steady at its June FOMC meeting.
The residential sector of the U.S. economy has been a pillar of strength over the last several years. This has helped to soften the blow from weaker government spending during the same period. Despite falling interest rates, housing activity was quite weak in April. This is a concern for the economy, and along with slowing inflation, just may lead the Fed to hold rates steady at its June FOMC meeting.
 RSS Feed