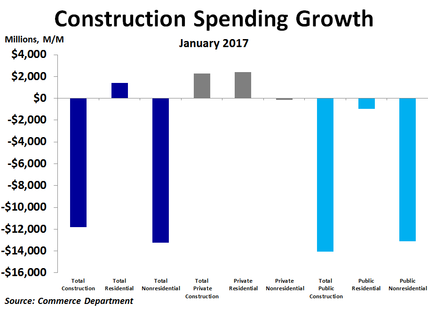
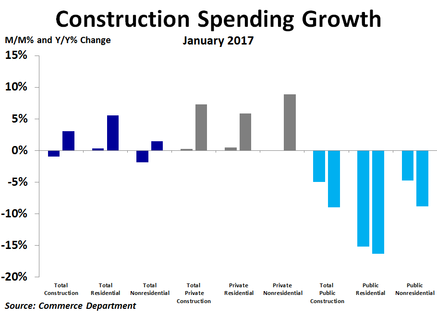
According to the Commerce Department, total construction spending fell by $11.8 billion, or 1.0%, in January to $1.18 trillion, although spending was still very close to the peak seen before the recession. Compared to a year ago, spending was up just 3.1%, on the lower end of the range of the last couple years.
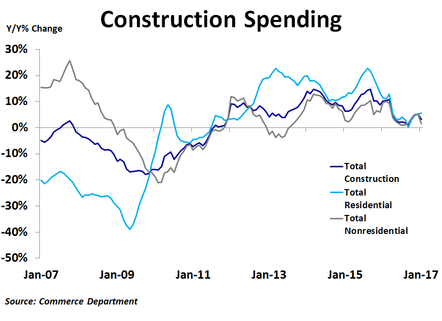
There was a noticeable difference in spending between residential and non-residential spending. While residential spending rose $1.4 billion, or 0.3%, from the prior month, non-residential spending plunged by $13.2 billion, or 1.9%. These measures were up 5.5% and 1.5% compared to a year ago, respectively.
Non-residential spending weakness was led by a $2.9 billion decline in spending on highways and streets, a $2.7 billion drop in transportation and a $2.3 billion decline in education. The only real bright spots were a $1.5 billion increase in spending on power and a $354 million increase in manufacturing.
There was also a noticeable difference between private and public spending. Private spending rose by $2.3 billion, driven exclusively by residential projects. Non-residential spending fell by $139 million, but within that was a $1.2 billion increase in spending on power and a $402 million increase in manufacturing. In contrast, public spending plunged by $14.1 billion, almost all of which came in the non-residential category. Public spending on highways and streets fell by $2.9 billion, transportation spending dropped by $2.5 billion and spending on education declined by $1.9 billion. The only real strength in the public sector came from spending on power and amusement and recreation projects.
Compared to a year ago, the strongest growth in total construction spending has come from lodging, office and commercial projects. On the flip side, the biggest declines have been seen in sewage and waste disposal, transportation and public safety projects.
The residential sector of the U.S. economy has been a pillar of strength over the last several years. This has helped to soften the blow from weaker government spending during the same period. Even so, the pace of residential spending growth has slowed from a peak of nearly 23% year-over-year two years ago to just 5.5% in January. With mortgage rates on the rise and home price growth slowing, we may be near the peak of this housing cycle. Spending on other projects will need to fill the void to support the economy if residential spending softens.
The residential sector of the U.S. economy has been a pillar of strength over the last several years. This has helped to soften the blow from weaker government spending during the same period. Even so, the pace of residential spending growth has slowed from a peak of nearly 23% year-over-year two years ago to just 5.5% in January. With mortgage rates on the rise and home price growth slowing, we may be near the peak of this housing cycle. Spending on other projects will need to fill the void to support the economy if residential spending softens.
 RSS Feed