Ed Kashmarek - The Everyday Economist
  • Home
  • About
    • Skills
    • Volunteering
    • Music
    • Microfinance
    • Photos
    • Book List
  • Work Samples
  • Reports
  • Blog
  • Charts
  • Podcast
  • Webinars
  • Tableau
    • Employment Analysis Tool (Web)
    • Employment Analysis Tool (Mobile)
    • GDP Analysis Tool (Web)
    • GDP Analysis Tool (Mobile)
    • MN Housing
  • Feedback
  • Join Email List
  • Booking

Job Growth Strong Again in July as Only One Industry Loses Jobs

8/4/2017

0 Comments

 
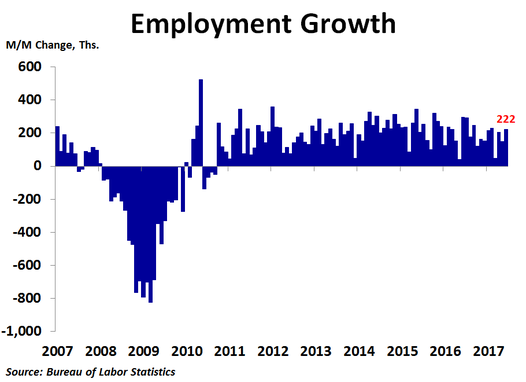
​Job growth was strong again in July as the economy added 209K new jobs, a little less than June’s 231K increase but much higher than the 178K consensus forecast. Revisions were negligible. The year-ago rate of job growth slipped to 1.5%, the lowest since May 2011.
Picture
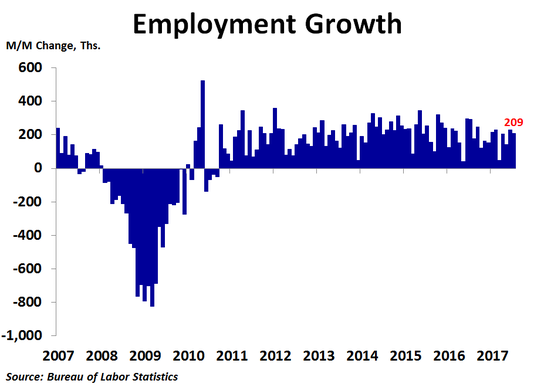
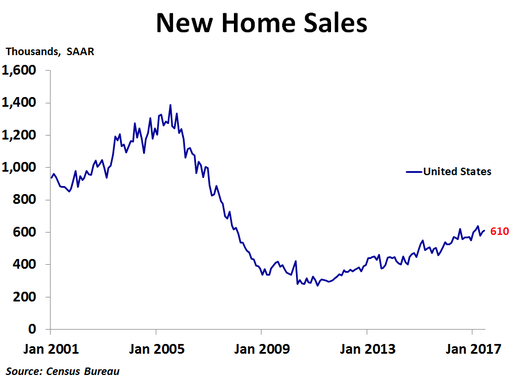
Leisure and hospitality services led the way in July, putting 62K more people to work, mostly in food services and drinking places. Education and healthcare services added 54K new positions, with 45K of them coming from healthcare. Professional and business services also had a strong month as 49K people found new jobs, 15K of which were in temporary help services. Manufacturing had a decent month as 16K more people were hired. Wholesale trade added 6K more people to staff. The construction industry had a fairly weak month as only 6K new jobs were created. In the last five months construction has only added 28K new jobs amid a slowdown in home building. Financial services also had a weak month, with only 6K new positions being filled. Information services added 4K new people to the payrolls, the second straight gain following eight months of losses totaling 62K jobs. This is good news as these are among the highest paid jobs in the economy. Government added just 4K new jobs following a surge in June. Following four months of losses, the retail industry has created 3K new jobs in the past two months; not much, but at least jobs are being created. Following eight straight months of gains, mining and logging employment was flat in July.  

​The only industry that lost jobs in July was utilities, and even that was a mild decline of just 900 positions. The fact that only one industry lost jobs in July goes to show how strong today’s report really is. 
Picture
The 22K decline in job growth in July versus June was largely due to much less hiring in government and fewer jobs being created in other services and healthcare.

Even though 349K people entered the labor force in July, the unemployment rate fell from 4.4% to 4.3% as 345K of them found jobs, a remarkable 99% success rate!  

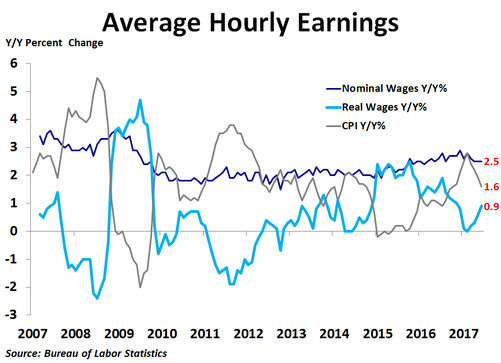
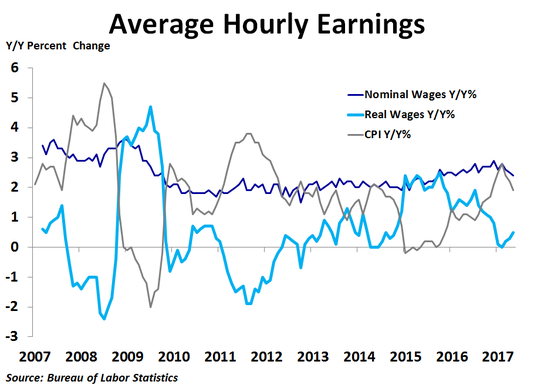
Average hourly earnings rose 0.3% and were up 2.5% from a year ago for the fourth straight month. With inflation cooling recently, real wage growth has rebounded slightly but remains very weak at just 0.9%.

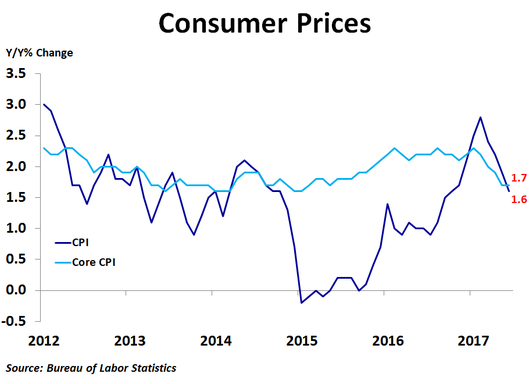
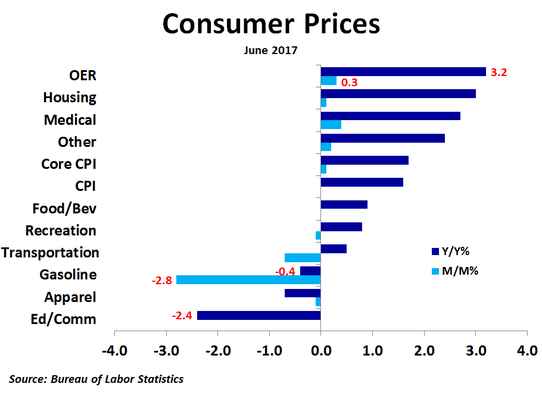
​Today’s report may give the hawks more incentive to push for another Fed rate hike soon. Even so, inflation remains well below the Fed’s target, so a rate hike is not necessary. 
0 Comments

Personal Income Flat in June, Spending Rises Slightly

8/3/2017

0 Comments

 
Personal income was flat in June compared to May, much less than the consensus forecast of a 0.4% increase, and was up 2.6% from a year ago. Personal spending rose just 0.1%, matching the consensus forecast, and was up 4.1% from a year ago, the slowest rate of growth since August. The personal savings rate fell slightly to 3.8%.
Picture
Compared to a month ago, rental income led the way with a 0.6% increase. Wages and salaries followed with a 0.4% increase, with both private and government wages rising at about the same rate. Personal current transfer receipts rose 0.2% as veterans’ benefits rose 1.2% and unemployment insurance increased 1.1%, the first increase since December. On the downside, proprietors’ income slipped 0.1% as farm income fell for the third straight month. Personal income receipts on assets plunged 1.8% as dividend income fell 3.0% following a big 4.8% jump in May.

Compared to a year ago, rental income topped the charts, up 5.5%, as high home prices are pushing up rents. Personal current transfer receipts were up 3.1%, led by a sharp 6.1% increase in veterans’ benefits. Wages and salaries were up 2.5%, with private and government wages up by pretty much the same percentage. Proprietors’ income was up 2.2% as non-farm income was up 3.6% while farm income was down 40.1%. Income on assets was up just 2.0%, driven largely by interest income.

Wages and salaries accounted for just under half of the total increase in personal income on a year-ago basis, most of which came from private industry wages. On a month-ago basis, wages and salaries rose by $30.9 billion, but that was more than offset by the $43.8 billion decline in income on assets.

​The growth rate of personal tax payments slowed to 2.5% from a year ago, leaving disposable income up 2.6%. After factoring in inflation, real personal disposable income growth dipped from 1.4% to 1.2%, and real spending slowed from 3.0% to 2.7%. 
Picture
​With inflation and real income and spending growth slowing, the Federal Reserve’s decision to leave the Fed Funds rate unchanged at last week’s FOMC meeting looks like a wise decision. In fact, there really was no reason to raise it in June either, but they did. They may now be regretting that move. The market has certainly changed its tune as Treasury yields have declined after the late June spike. The market is telling the Fed that inflation is not a concern. The Fed should listen. 
0 Comments

Construction Spending Plunges in June and the Weakness is Widespread

8/3/2017

1 Comment

 
​According to the Commerce Department, total construction spending plunged by $15.8 billion, or 1.3%, in June to $1.21 trillion, widely missing the consensus forecast of a 0.5% increase. This follows a 0.3% increase in May that was revised up from no change. Compared to a year ago, spending was up just 1.6%, the least since November 2011. 
Picture
Weakness was widespread in June. Residential spending fell by $1.4 billion, or 0.3%, from the prior month but was up 9.0% from the prior year. Non-residential spending plunged by $14.4 billion, or 2.0%, and was down 3.1% from the prior year, the worst in four years.

For non-residential spending, only two of fifteen categories saw spending increases. Spending on office projects rose by $1.4 billion, or 1.9%, and spending on communications projects rose by $612 million, or 2.8%. Every other category saw spending fall, led by a huge $5.7 billion, or 6.4%, decline in spending on highways and streets, which took the level of spending down to the lowest in over three years. Other notable declines were a $3.9 billion, or 4.3%, decline in education spending and a $1.2 billion, or 1.8%, decline in manufacturing. The biggest percentage declines came in conservation and development, where spending dropped 7.3%, and public safety, where spending fell 6.5% from the prior month.                 

​Private spending only fell by $573 million, or 0.1%, with all of the decline coming from residential projects. Although non-residential spending rose by $503 million, or 0.1%, that included a $1.8 billion, or 2.9%, increase in spending on office projects and a $1.3 billion, or 1.9%, decrease in manufacturing. Meanwhile, public spending cratered by $15.2 billion, or 5.4%, half of which came from just two categories, with highway and street projects falling by $5.8 billion, or 6.6%, and education spending dropping by $3.9 billion, or 5.5%. Thus, 94% of the drop in total  spending came from public non-residential projects.  
Picture
Compared to a year ago, the strongest growth in total construction spending has come from residential, office and commercial projects. Conversely, the biggest declines have been seen in conservation/development, sewage and waste disposal and water supply.

​Last week the Federal Reserve held the Fed Funds rate steady. Today’s very weak report suggests that was a wise move. With inflation slowing, Treasury yields and mortgage rates have been trending down, which should help to support the construction industry. 
1 Comment

Consumer Spending Drives Rebound in Second Quarter GDP Growth

7/28/2017

0 Comments

 
​The U.S. economy gained strength in the second quarter, growing at an annualized rate of 2.6% from the previous quarter, far better than the 1.2% pace in the first quarter and in line with the consensus forecast. Compared to a year ago, the economy grew 2.1%, up from the first quarter’s 2.0% pace.
Picture
Consumer spending rebounded from a fairly weak first quarter, rising 2.8% from the previous quarter following the first quarter’s tepid 1.9% tally. Spending on goods rose 4.7%, as durable goods spending increased 6.3% and non-durable goods spending rose 3.8%, while spending on services rose just 1.9%. Gross private domestic investment rose 2.0%, but that was coming off a decline in the first quarter. Nonresidential investment rose 5.2%, driven by a strong 8.2% increase in equipment. Spending on structures rose 4.9% while spending on intellectual property inched up by 1.4%. Following a strong first quarter, residential investment fell 6.8%, the biggest decline since the third quarter of 2010. Private inventories actually declined in the second quarter, the first time that has happened since the third quarter of 2011 and certainly a big reason why overall growth was not stronger. Exports rose 4.1% while imports rose just 2.1%, helping to narrow the trade deficit slightly. Government spending rose 0.7%, but it was all at the federal level as national defense spending rose 5.2% while non-defense spending fell 1.9%. Meanwhile, state and local government spending declined 0.2%.

​The contributions to growth were as follows: consumer spending 1.93 percentage points (pp), gross private domestic investment  0.34 percentage points (pp), which was weighed down by a decline in inventories, net exports 0.18 pp and government spending 0.12 pp.
Picture
​Today’s report is welcome news following two quarters of fairly weak economic growth, and will certainly be some relief for the Trump administration that appears to be in complete political chaos at the moment. Unfortunately, the vast majority of growth was from consumer spending, while all other parts of the economy contributed very little to growth. It was also disappointing to see one of the economy’s major drivers since the recession, residential investment, take a step back even though mortgage rates have been trending down recently. Should the Federal Reserve either raise the Fed Funds rate or start to trim its balance sheet, mortgage rates could rise and might put a big dent in housing and the economy. Thus, the Fed best tread carefully.
0 Comments

New Home Sales Rise in June as the Median Price Declines

7/26/2017

0 Comments

 
​New home sales rose in June to 610K units on a seasonally adjusted annualized basis, up from 605K units in May, which was revised down from 610K units, and in line with the consensus forecast of 611K units. Sales were up 0.8% from May and 9.3% from a year ago.
Picture
Sales rose 12.5% from the prior month in the West and 10.0% in the Midwest. However, sales were flat in the Northeast and fell 6.1% in the South. Compared to a year ago, sales were up 46.4% in the Northeast, 34.3% in the West and 0.6% in the South, but were down a steep 12.0% in the Midwest.

​In the second quarter, the national median price was up 1.8% from the prior year. Prices were up 7.6% in the Midwest and 2.4% in the West, but were down 1.6% in the South and 6.6% in the Northeast. The Census Bureau does not report regional median prices by month, only quarterly and annually. In June, the national median price fell to $310,800, a 4.2% decline from the prior month, following a notable increase in May. Compared to a year ago, the median price was down 3.4%, the third year-ago decline in the past five months. The 12-month moving average trend of price growth has been slowing over the last couple of years, and in June reached a new cyclical low of 2.4%. This suggests new home prices may be getting close to a cyclical peak. The decline in the median price in June had a lot to do with a change in the mix of homes sold, as sales in the $200K-$299K price range rose while sales in the $300K-$399K price range declined.  
Picture
As with the existing home market, inventory continues to be a big story right now. In June, there was only 5.4 months’ worth of supply available. Although that is up from 5.0 months in March, it is still far below the supply levels of the previous boom and on the low end of the 5-6 month range generally considered a balanced market. Fortunately, the number of new homes for sale has jumped in the last few months and is at the highest level since June 2009. This has helped to keep prices fairly stable recently. In addition, mortgage rates have been trending down over the last few weeks amid political uncertainty and slowing inflation.

​With inflation slowing and still below the Fed’s target of 2.0%, the Fed held rates steady at today’s FOMC meeting. However, the bigger issue is when the Fed will start to reduce its balance sheet, which they said will begin relatively soon. This will likely push up mortgage rates, but inflation will also play a big part.
0 Comments

Rebound in Building Permits Drives Leading Economic Indicators Index Higher in June

7/24/2017

0 Comments

 
​The leading economic indicators index rose 0.6% in June from the prior month following a downwardly revised 0.2% increase in May. The increase was better than the consensus forecast of a 0.4% rise. Compared to a year ago, the index was up 4.0%, far higher than May’s 2.7% pace. Over the six month period ending in June, the index was up 2.5%, up slightly from the 2.3% rate of growth in the six months ending in May.
Picture
Building permits led the way in June, contributing 0.21 percentage points to the growth in the overall index, as building permits rebounded from a very weak May to post a strong 1.254 million unit annualized reading for June. The ISM new orders index came in second, contributing 0.17 percentage points as the index rose to 63.5 in June from 59.5 in May. The interest rate spread between the 10-year Treasury yield and the Federal Funds rate was next, contributing 0.13 percentage points to the growth in the index. Although this was the smallest contribution from this component since July as the spread has narrowed, this component has still contributed the most to the rise in the index over the past six months. Consumer expectations for business conditions contributed just 0.06 percentage points, the smallest contribution for this component since November, as consumers have become more concerned that Trump’s pro-growth policies may not come to fruition as soon as previously thought, if at all. The contribution from the stock market held steady at 0.06 percentage points as the market rose slightly in June. For the fifth month in a row, core capital goods orders contributed virtually nothing in June.           

​The only negative contribution came from initial jobless claims, as average weekly claims rose to 244K in June from 240K in May.

Picture
Although the interest rate spread is often among the largest contributors, its contribution has been trending slightly lower over the last few months as the Federal Reserve has been gradually raising the Federal Funds rate while the 10-year Treasury yield has come down as investors’ initial optimism about the new administration’s economic policies has been followed by some doubt about the chances for successful implementation.

​Given slowing inflation, weak wage growth and signs of a possible top in housing, the Fed’s June rate hike appears a bit misplaced. However, the LEI is suggesting growth should pick up soon. It remains to be seen if inflation, and interest rates, follow suit.
0 Comments

Existing Home Sales Fall in June Amid Lower Inventories and Higher Prices

7/24/2017

0 Comments

 
​Existing home sales fell in June to 5.52 million units on a seasonally adjusted annualized basis, down from May’s 5.62 million units and less than the consensus forecast of 5.58 million units. Sales were down 1.8% from the prior month and up just 0.7% from a year ago, the lowest year-ago increase since August. 
Picture
By region, sales increased 3.1% from the prior month in the Midwest, the only region to see an increase in sales in June. The rebound in the Midwest in June was not a surprise since sales in May were very weak. Elsewhere, sales fell 0.8% in the West, 2.6% in the Northeast and 4.7% in the South. Compared to a year ago, sales were up the most in the West at 2.5% and up 1.3% in the Northeast. Sales were flat compared to a year ago in the South and the Midwest. Median prices were up the most in the Midwest at 7.7% compared to a year ago, while they were up 7.4% in the West, 6.2% in the South and 4.1% in the Northeast. The national median price was up 6.5%, up from May’s 5.7% rate of growth and the first increase in the year-ago rate of growth in four months.

By type, sales were flat compared to the prior month for condos and co-ops and down 2.0% for single-family homes. On a year-ago basis, sales were up 1.6% for condos and co-ops and 0.6% for single-family homes. Prices were up 6.6% for single-family homes and 6.5% for condos and co-ops.
Picture
Inventory continues to be a big story right now. In June, inventories fell 0.5%. However, since sales fell a larger 1.8%, the ratio of inventories to sales, or the months’ supply, rose from 4.2 to 4.3. Even so, the 12-month moving average slipped a few decimal points to 4.1 months, down significantly from a couple years ago. One big reason that inventories are so low is that some people who bought homes at the peak of the bubble in 2006 still have not recuperated all of their losses. On the other hand, many who would like to upgrade are finding prices too high so they are staying in their current home, preventing others from buying their house and keeping supply limited. What homes do get listed are often scooped up quickly, and sellers are getting multiple offers that in some cases are above the asking price. This suggests a peak in prices may be near.

​Sales fell in June despite a decline in mortgage rates. On Wednesday, the Federal Reserve is expected to provide more details on the plan to reduce its balance sheet, which could push mortgage rates higher. The real estate market would be well advised to tune in. 
0 Comments

Falling Fuel Prices Keep Consumer Prices Unchanged in June

7/14/2017

0 Comments

 
​Consumer prices were unchanged in June from the previous month, missing the consensus forecast of a 0.1% increase, following a 0.1% decrease in May. Compared to a year ago, prices were up just 1.6%, down from May’s 1.9% pace and the lowest since October. Core prices, which exclude food and energy, rose 0.1%, missing the forecast of a 0.2% increase, and were up 1.7% on a year-ago basis, matching May for the slowest rate of growth in two years.
Picture
Compared to a month ago, prices rose the most for motor vehicle insurance (+1.0%), hospital services (+0.9%), medical care commodities (+0.7%), meats and poultry (+0.6%) and owners’ equivalent rent of primary residences (+0.3%). Prices fell the most for fuel oil (-3.7%), gasoline (-2.8%), airline fares (-2.7%), used cars and trucks (-0.7%) and electricity (-0.6%). Thus, air and road travel both became less expensive, but it became more expensive to insure a vehicle. Owners’ equivalent rent, motor vehicle insurance and hospital services had the largest positive effects on the price index, while the biggest negative effects came from gasoline, household energy and other lodging away from home.

Compared to a year ago, prices were up the most for piped gas service (+12.8%), motor vehicle insurance (+7.7%), tobacco and smoking products (+6.8%), hospital services (+5.7%) and fuel oil (+4.3%). Prices were down the most for used cars and trucks (-4.3%), airline fares (-4.3%), meats and poultry (-0.9%), apparel (-0.7%) and gasoline (-0.4%). Yes, you heard right, gasoline prices are now down from a year ago after being up a whopping 31% from the prior year back in February. The biggest positive effects on a year-ago basis came from owners’ equivalent rent, motor vehicle insurance and hospital services, while the biggest negative effects came from wireless phone services, education and communication services and used cars and trucks. 
Picture
​Despite a slew of weak economic data in May, the Fed raised interest rates anyway at the June FOMC meeting, citing a low unemployment rate and expected improvement in inflation and job growth. Since then, we have been treated to another month of weak wage growth, retail sales, producer price data and consumer price data. Although employment growth is strong and unemployment is low, inflation is starting to cool again. This would suggest no rate hike at the Fed’s July meeting, but that’s what we thought last time. If inflation is their priority, a rate hike is not needed. 
0 Comments

Retail Sales Unexpectedly Fall in June as Gasoline Sales Decline

7/14/2017

0 Comments

 
​Retail sales fell 0.2% in June from the prior month, missing the consensus forecast of a 0.1% increase, following a 0.1% decrease in May that was revised up from a 0.3% decline. Sales excluding autos and gas missed expectations badly, falling 0.1% compared to expectations of a 0.4% increase. On a year-over-year basis, sales were up just 3.1%, down from the recent peak growth rate of 5.6% reached in January and the least since August. 
Picture
The biggest monthly increase in dollar terms was a $213 million, or 0.4%, increase in general merchandise sales. Non-store sales followed with a $193 million, or 0.4% increase. Building and garden supply stores took the third spot with a $161 million, or 0.5% increase. All three of these categories did better than vehicles, which only saw a $128 million, or 0.1%, rise in sales. The biggest decline in sales came from gasoline stations, where sales fell by $484 million, or 1.3%, as gas prices dropped. The miscellaneous category saw sales fall by $338 million, or 3.1%, the largest percentage drop of any category. Food and drink sales followed with a $324 million, or 0.6%, decline. Department store sales fell by $91 million, or 0.7%, as the industry continues to be challenged by online competitors.

​Sales were higher on a year-over-year basis, led by a $4.8 billion, or 5.6%, increase in vehicle sales. Non-store sales were next with a $4.5 billion, or 9.6%, increase. Building and garden supply store sales have also been strong and were up $1.5 billion, or 5.2%, from a year ago. Only two categories were down from a year ago, led by a $528 million, or 6.9%, decline in sports and hobby stores. Department store sales were also down by $518 million, or 4.0%.
Picture
If we take out the impact of gasoline sales, which are not really an indication of stronger or weaker economic growth but rather due to changing gas prices, ex-gas retail sales were up only 3.2% from a year ago in June, the least since August. If we also adjust for inflation, we see that real ex-gas retail sales were up just 1.6% in June, still on the lower end of the recent range, which has been trending down for two years.  

​Despite all of the weak May data, the Federal Reserve raised interest rates in June. Today’s retail sales report, along with another month of weaker than expected inflation data for June, suggests the June rate hike was probably not a wise move. If the weakness in housing data that we saw in May continued in June as well, criticism of the Fed may ramp up.
0 Comments

Healthcare and Local Government Spur Big Upside Surprise in Job Growth in June

7/7/2017

0 Comments

 
Job growth roared higher in June as the economy added 222K new jobs, much better than May’s 152K increase and much higher than the 170K consensus forecast. Even better, revisions showed 33K more jobs were created in April and 14K more jobs were created in May than previously reported. The rate of job growth held at 1.6% year-over-year.
Picture
Healthcare led the way in June with a 59K increase in payrolls, double May’s increase. Leisure and hospitality services followed with a 36K increase after a fairly weak 25K increase in May. Professional and business services added just 35K new positions, one of the lowest readings in the past year, as administrative and waste services saw the weakest job growth since December following a big increase in May. Government was a big surprise as 35K people found new jobs in public service, coming almost exclusively at the local level. The construction industry had a decent month as 16K people found work following three very weak months amid slowing activity in the housing market. Following four straight monthly declines, retail trade finally saw an increase in payrolls in June as the industry added 8K new jobs. Mining and logging had another good month as 8K new jobs were created, the eighth straight increase. After losing 2K jobs in May, manufacturing could only muster a 1K job gain in June as the motor vehicle industry is in a bit of a rut.  

On the downside, information services lost 4K more jobs, the ninth straight monthly decline, which is bad news since these are some of the highest paying jobs in the economy. Motor vehicle and parts manufacturing lost 1K jobs as sales continue to dwindle.

​The 70K difference in job growth in June versus May was largely due to the big increase in local government jobs and the rebound in healthcare services employment.
Picture
Although the unemployment rate rose from 4.3% to 4.4%, it was because 361K people entered the labor force, but only 245K of them found work. Thus, the increase in the unemployment rate was for a good reason as people were more confident about finding jobs.  

Average hourly earnings rose 0.2% and were up 2.5% from a year ago, down a bit from the 2.9% pace back in December. With inflation cooling recently, real wage growth has rebounded slightly but remains very weak.

​Today’s report will give the hawks more incentive to push for another Fed rate hike soon. Even so, inflation remains well below the Fed’s target, so a rate hike is not necessary.  
0 Comments
<<Previous
Forward>>

    Archives

    September 2017
    August 2017
    July 2017
    June 2017
    May 2017
    April 2017
    March 2017
    February 2017
    June 2013
    May 2013

    Categories

    All
    Construction Spending
    CPI
    Employment Report
    Existing Home Sales
    GDP
    Housing Market Index
    Import Prices
    Industrial Production
    Leading Economic Indicators
    New Home Sales
    Personal Income And Outlays
    Producer Prices
    Retail Sales
    Small Business Optimism
    Trade

    RSS Feed

Proudly powered by Weebly