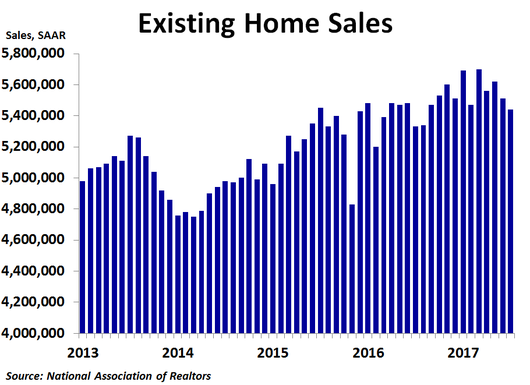
New home sales fell in August to 560K units on a seasonally adjusted annualized basis, down from 580K units in July, which was revised up from 571K units, less than the consensus forecast of 583K units and the lowest since December 2016. Sales were down 3.4% from July but were up 0.2% from a year ago.
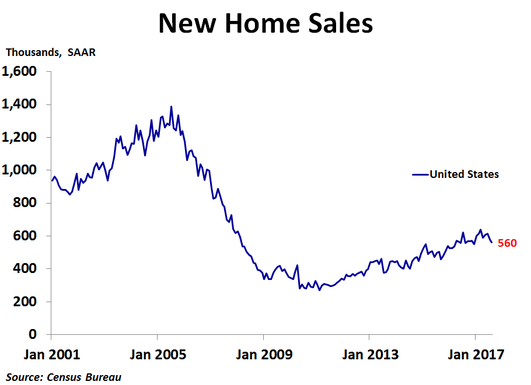
Sales fell the most in the South, down 4.7% from July, as Hurricane Harvey wreaked havoc near the end of the month. Sales fell 2.7% in the West, which may have been partly due to the massive wildfires, and fell 2.6% in the Northeast. Sales in the Midwest were flat.
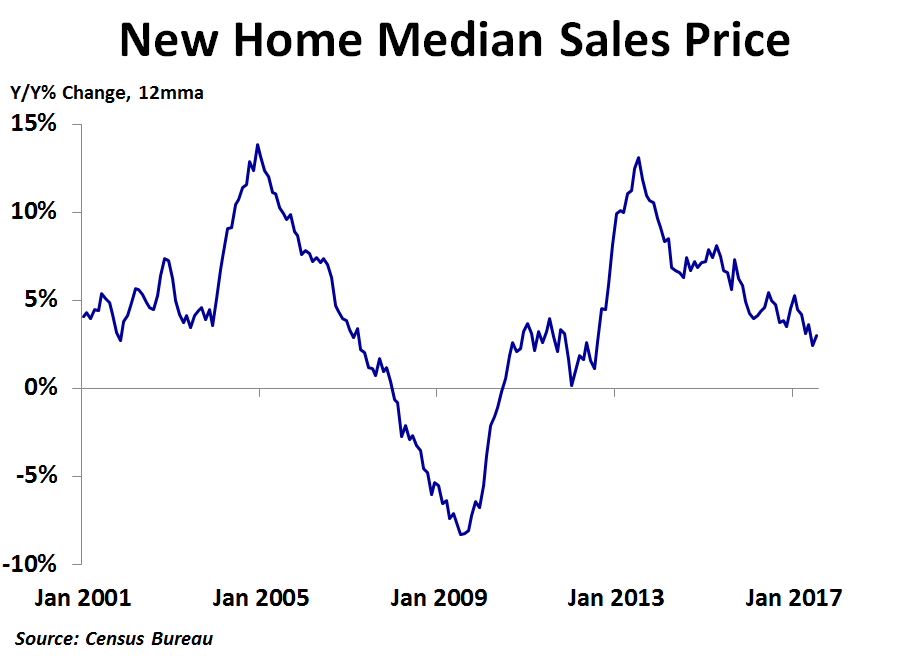
In the second quarter, the national median price was up 1.8% from the prior year. Prices were up 7.6% in the Midwest and 2.4% in the West, but were down 1.6% in the South and 6.6% in the Northeast. The Census Bureau does not report regional median prices by month, only quarterly and annually. In August, the national median price fell to $300,200, a 6.2% decline from the prior month and the biggest since May 2016, following a 1.1% increase in July. This was the sixth straight month where the direction of price changes on a month-ago basis was opposite that of the prior month. Compared to a year ago, the median price was up just 0.4%. After revisions, the 12-month moving average trend of price growth has been fairly steady over the last couple of years, coming in at 3.9% in August, up a bit from 2.9% in January 2016. This contrasts with a noticeable downward trend in this measure before the price revisions in today’s report.
In the second quarter, the national median price was up 1.8% from the prior year. Prices were up 7.6% in the Midwest and 2.4% in the West, but were down 1.6% in the South and 6.6% in the Northeast. The Census Bureau does not report regional median prices by month, only quarterly and annually. In August, the national median price fell to $300,200, a 6.2% decline from the prior month and the biggest since May 2016, following a 1.1% increase in July. This was the sixth straight month where the direction of price changes on a month-ago basis was opposite that of the prior month. Compared to a year ago, the median price was up just 0.4%. After revisions, the 12-month moving average trend of price growth has been fairly steady over the last couple of years, coming in at 3.9% in August, up a bit from 2.9% in January 2016. This contrasts with a noticeable downward trend in this measure before the price revisions in today’s report.
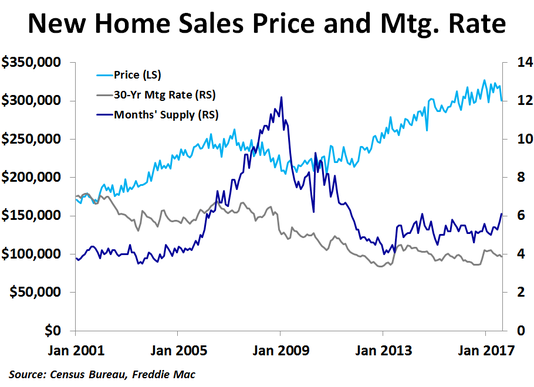
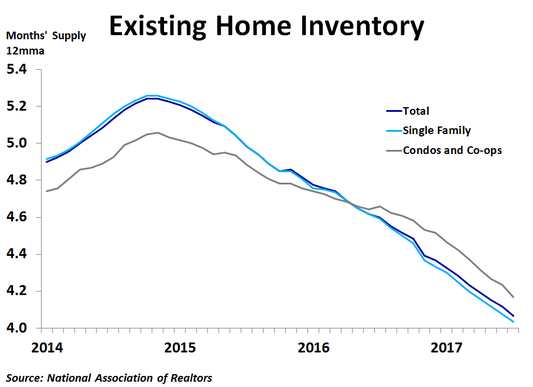
In August, there was 6.1 months’ worth of supply available, a notable increase from July’s 5.7 months and the most since July 2014. An increase in inventory for sale to the highest since May 2009 and a decline in sales both led to the increase in months’ supply. Since 5-6 months’ supply is generally considered a balanced market, the market appears to be in fairly good balance right now. This has helped to keep prices fairly stable recently, albeit still very high. The weakness in sales came despite a third straight month of sub-4% mortgage rates amid political and geopolitical uncertainty and slow inflation.
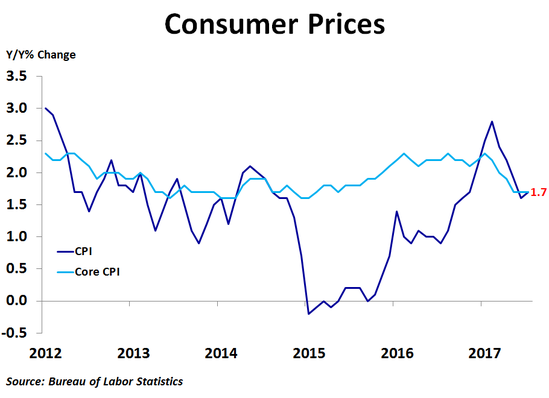
With inflation still below the Fed’s target of 2.0%, the Fed held rates steady at last week’s FOMC meeting. However, they did give a start date of October to begin reducing their balance sheet. This may push up mortgage rates, but inflation and politics will also be factors. Earlier today Janet Yellen confirmed my opinion that the June rate hike was a mistake.
With inflation still below the Fed’s target of 2.0%, the Fed held rates steady at last week’s FOMC meeting. However, they did give a start date of October to begin reducing their balance sheet. This may push up mortgage rates, but inflation and politics will also be factors. Earlier today Janet Yellen confirmed my opinion that the June rate hike was a mistake.


 RSS Feed